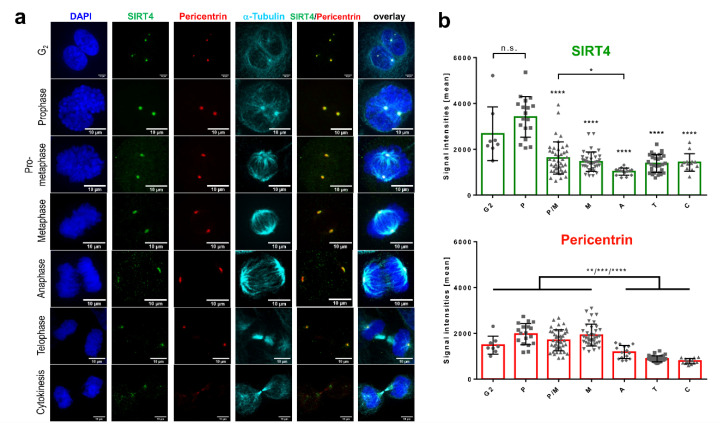
Figure 1.
Centrosomal localization pattern of SIRT4 during G2/M progression. (a) Endogenous SIRT4 was detected in HeLa cells in G2 and subsequent mitotic stages using a polyclonal antibody against SIRT4 (sc-135053; Santa Cruz Biotechnology, Heidelberg, Germany) and spinning disk microscopy. Antibody staining against Pericentrin and α-tubulin was employed to visualize centrosomes and microtubules, respectively. DAPI was used to detect DNA. Bar: 10 µm. (b) Quantification of centrosomal SIRT4 and Pericentrin levels during G2/M progression. Endogenous SIRT4 and Pericentrin were detected in HeLa cells as indicated above. Shown are mean signal intensities (±S.D.) which were analyzed using ImageJ software (v1.49k; Materials and Methods). Numbers of cells analyzed per cell cycle phase: G2, n = 8; P, prophase, n = 17; P/M, prometaphase, n = 42; M, metaphase, n = 38; A, anaphase, n = 15; T, telophase, n = 32; and C, cytokinesis, n = 13. To evaluate statistical significance (comparison of SIRT4 intensities between Prophase and G2 or mitotic phases) one-way ANOVA followed-up by Tukey’s test was performed (* p < 0.05; ** p < 0.01; *** p < 0.001; **** p < 0.0001; n.s., not significant).

