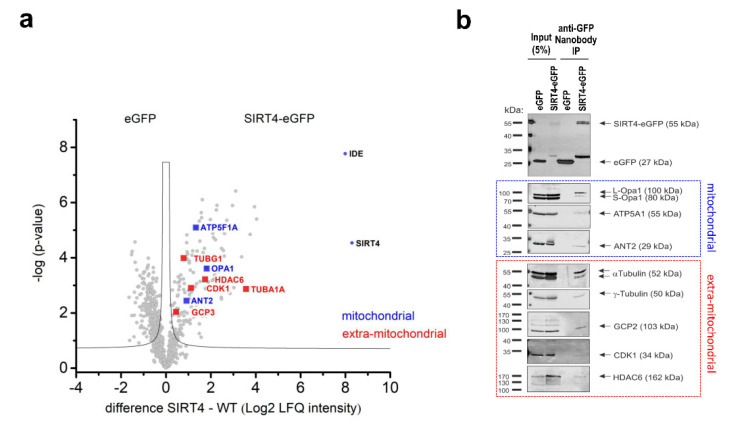
Figure 5.
Analysis of the mitotic SIRT4 interactome by mass spectrometry. (a) Volcano plot analysis of mitochondrial and extra-mitochondrial proteins interacting with SIRT4. HEK293 cells stably expressing eGFP or SIRT4-eGFP (n = 4 replicates each) were arrested in G2 by the reversible CDK1 inhibitor RO3306 followed by release into mitosis (45 min after RO3306 wash out). Total cell lysates were subjected to anti-eGFP nanobody co-immunoprecipitations followed by their mass spectrometric analysis. (b) Anti-eGFP nanobody co-immunoprecipitations of selected mitochondrial and extra-mitochondrial SIRT4 interacting proteins as compared to eGFP controls. Total cell lysates analyzed in (a) were employed.

