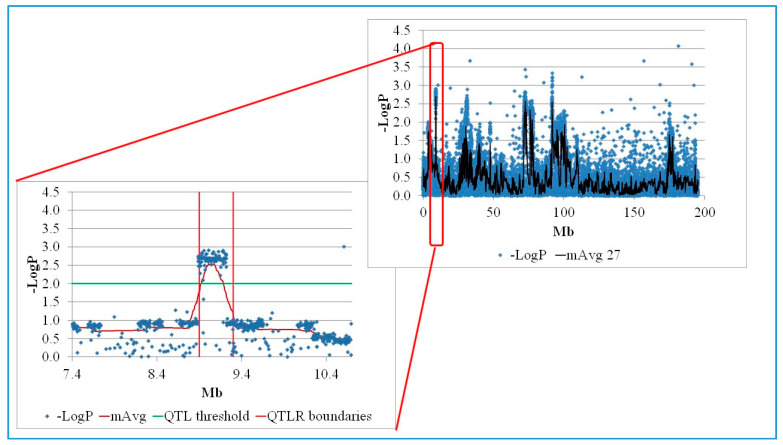
Figure 1.
Manhattan plot of a significant F6 QTLR (Family 3: QTLR 1, Chromosome 1). LogP, −log10P of a single marker; mAvg, moving average of −LogP values of a window of 27 markers; QTLR boundaries, boundaries of the quantitative trait locus region obtained by Log Drop 1 (see Section 2.6).

