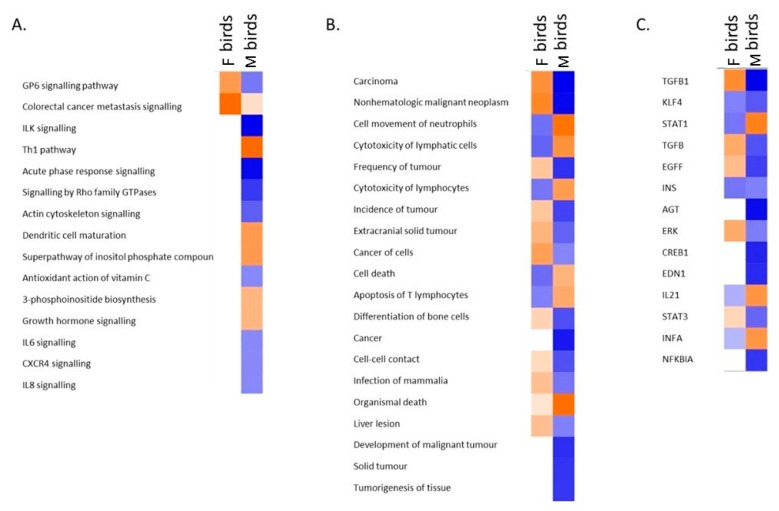
Figure 3.
Comparison of the gene expression underlying the host response in W36 birds. Orange colours represent up-regulation while blue indicates down-regulation. Differential activation/repression is indicated as shown: (A). Biological pathways (B). Diseases and biofunctions (C). Upstream regulators.

