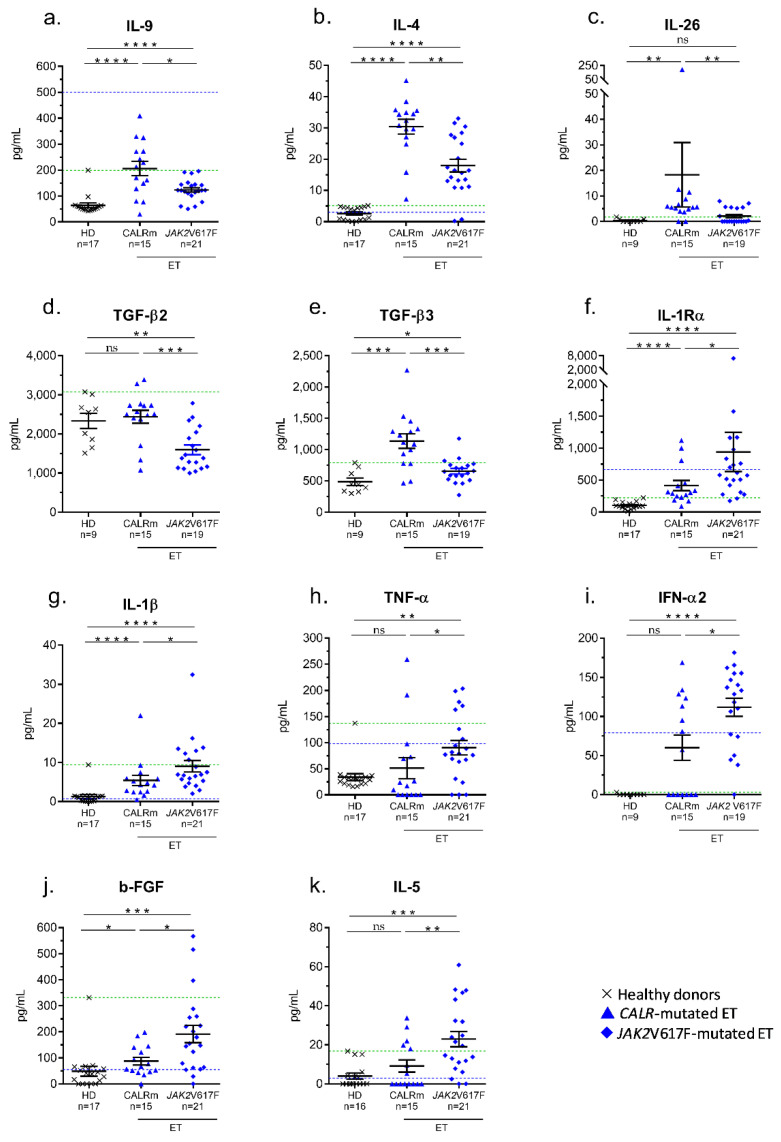
Figure 3.
Differences in cytokine levels in CALR- and JAK2V617F-mutated ET. Significant differences were found between CALR- and JAK2V617F- mutated ET for 9 cytokines: (a) IL-9; (b) IL-4; (c) IL-26; (d) TGF-β2; (e) TGF-β3; (f) IL-1Rα; (g) IL-1β; (h) TNF-α; (i) IFN-α2; (j) b-FGF; (k) IL-5. Results are presented as the means + SEM; note the changes in scales (Y axis). (*) p < 0.05, (**) p < 0.01, (***) p < 0.001 and (****) p < 0.0001, Mann–Whitney t-test. Dotted blue lines represent the upper normal values for healthy individuals according to the manufacturers of the BioPlex Pro-human Cytokine kits, measured in 66 healthy donors. Dotted green lines represent the upper normal values for healthy individuals as measured in our control cohort of 17 healthy donors.

