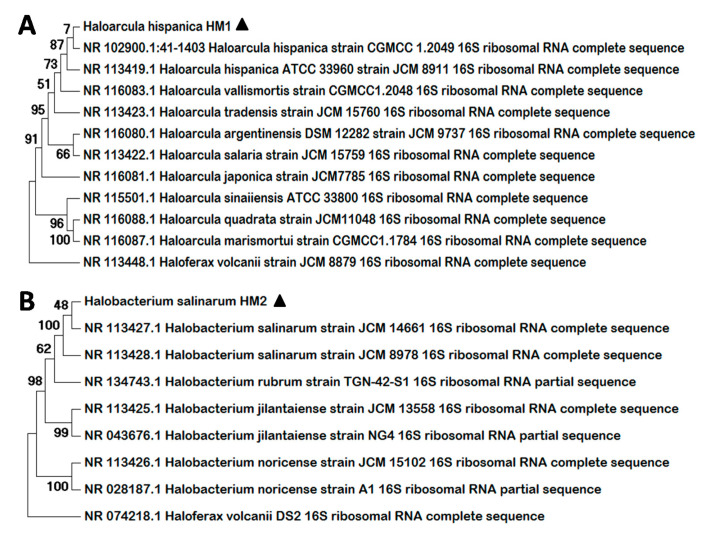
Figure 1.
Molecular Phylogenetic Analysis by Maximum Likelihood Method. The trees represent a comparison among the 16S rRNA sequences from the new strains isolated, H. hispanica HM1 (A) and H. salinarum HM2 (B), and a series of reference archaeal sequences. Multiple alignments were generated by MUSCLE (MUltiple Sequence Comparison by Log-Expectation) and the trees were constructed with MEGA 7. The numbers at nodes indicate the bootstrap values calculated for 1000 replicates. The name and the NCBI access number are indicated for all the reference sequences. Black triangles indicate the new strains identified.

