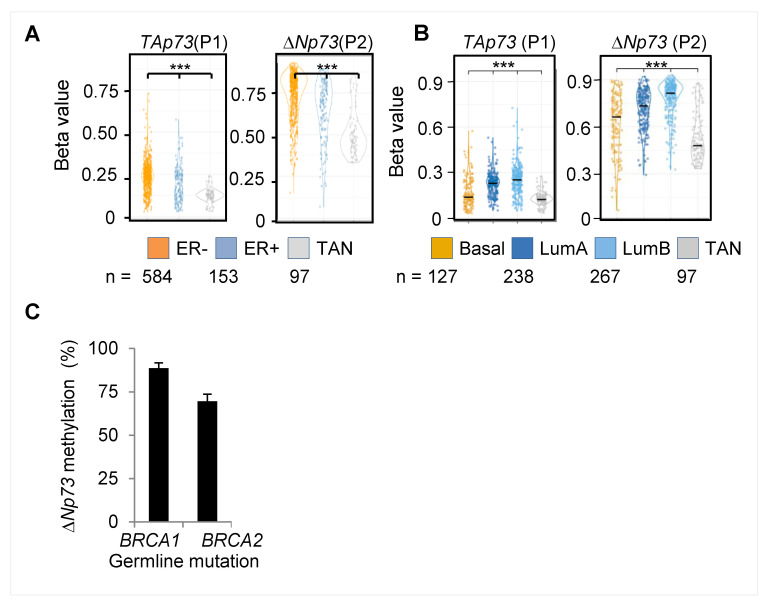
Figure 7.
DNA methylation at the TP73 gene in breast cancers. (A,B) TCGA analysis shows distribution of average methylation groups for all Illumina probes located at the P1 or the P2 promoter regions among (A) ER+ and ER- breast tumors or (B) PAM50 breast tumor subtypes. *** represent p-values < 0.001 by Welch two-sample t-test. (C) q-MSP analysis of the deltaNp73 promoter (P2) in breast tumors of BRCA1 (n = 16) and BRCA2 (n = 6) germline mutation carriers. Columns represent the mean ± S.E.M. ER- estrogen receptor, Lum–luminal, TAN–tumor adjacent normal tissue

