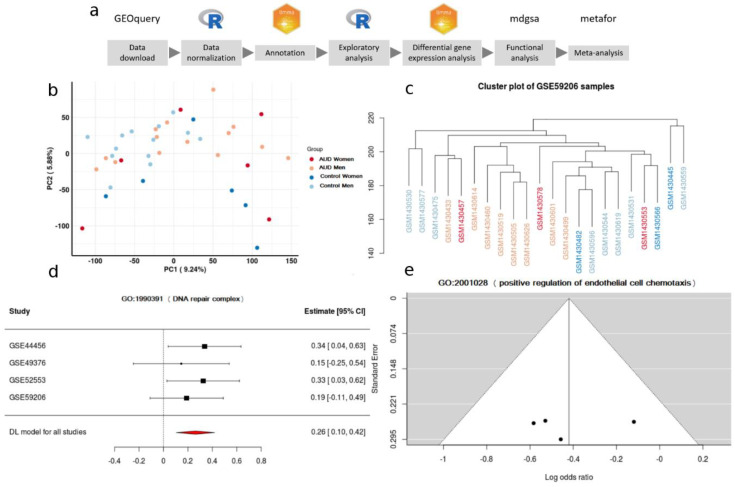
Figure 1.
(a) Data-analysis workflow. (b) Principal Component Analysis plot in the GSE44456 study. (c) Clustering. (d) A forest plot of the GO:1900391, showing the LOR (log odds ratio) of each study and the global result. (e) Funnel plot of the GO:2001028; dots in the white area indicates the absence of bias and heterogeneity.

