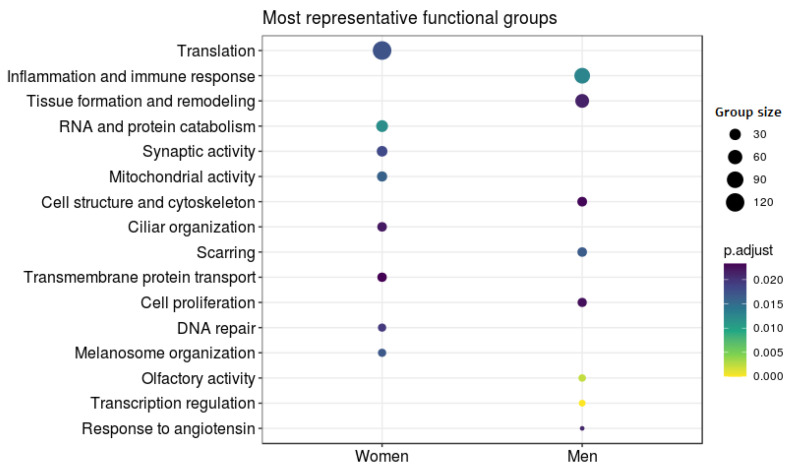
Figure 5.
Differential Functional Profiling by Sex. The dot plot shows the functional groups with the greatest differential activity between the sexes. Each dot represents a biological function. Size indicates the number of genes involved in that function and color associated with the level of significance.

