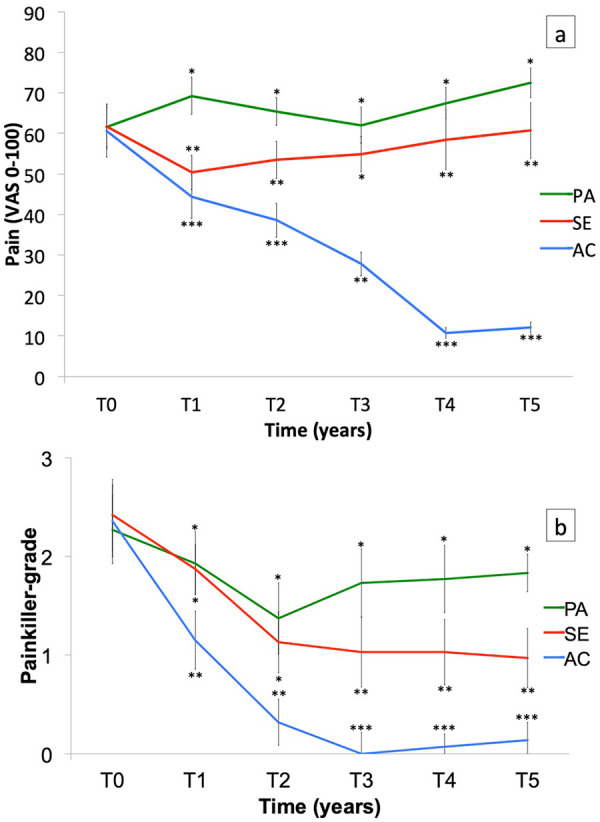
Figure 3.

(a) Pain assessed by a visual analog scale (VAS) and (b) painkiller ladder in Active (AC), Semi-Active (SE) and Passive (PA) groups over 5 years (T0, T1, T2, T3, T4 and T5). Bars are standard error of the mean.
*Significant difference (p < 0.05) for intergroup comparison at each time.
