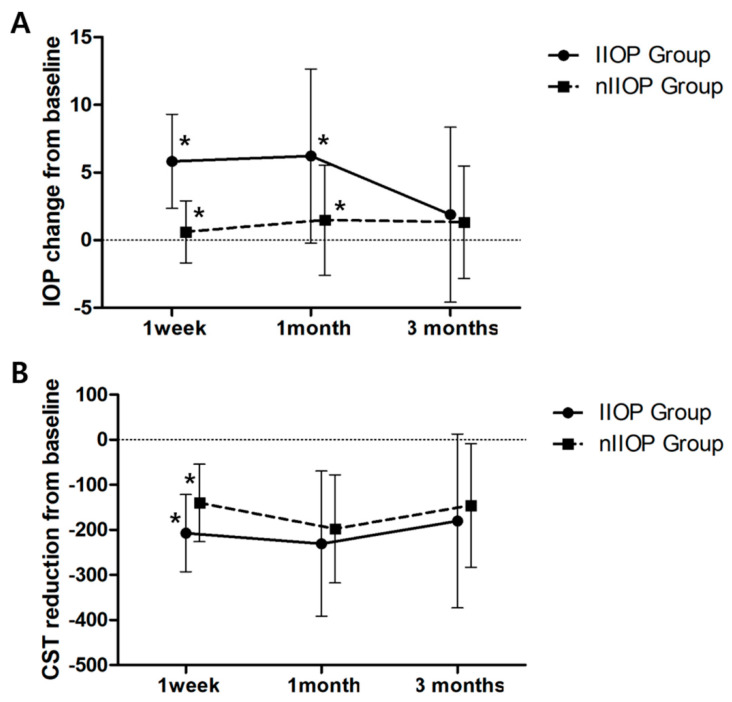
Figure 1.
Graph illustrating changes in mean intraocular pressure (IOP) elevation and mean central subfield thickness (CST) reduction after intravitreal dexamethasone (DEX) implantation between the increase of IOP (IIOP) group and non-IIOP (nIIOP) group. (A) Mean IOP change. (B) Mean CST reduction. Asterisk (*) means significant difference between the groups.

