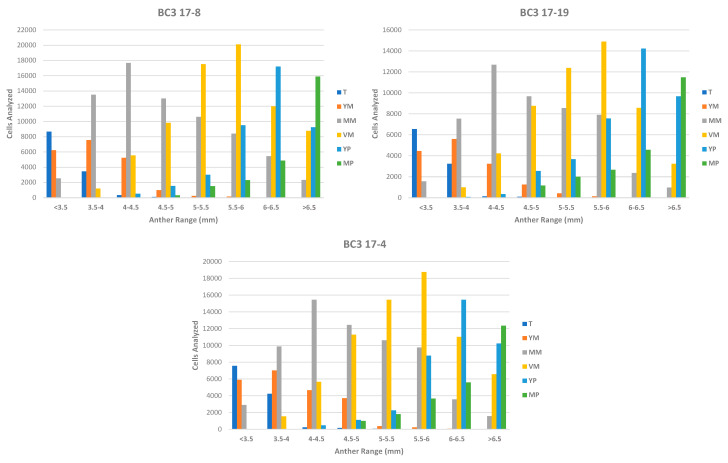
Figure 5.
Distribution of the cell types identified by Microscan within each anther range in the three genotypes used for the Phase 2 experiments. The Y axis shows the number of cells classified for each type; the X axis shows the anther range corresponding to each analysis. The color code in the legend indicates the cell type, tetrad (T), young microspores (YM), medium microspores (MM), vacuolated microspores (VM), young pollen (YP) and mature pollen (MP).

