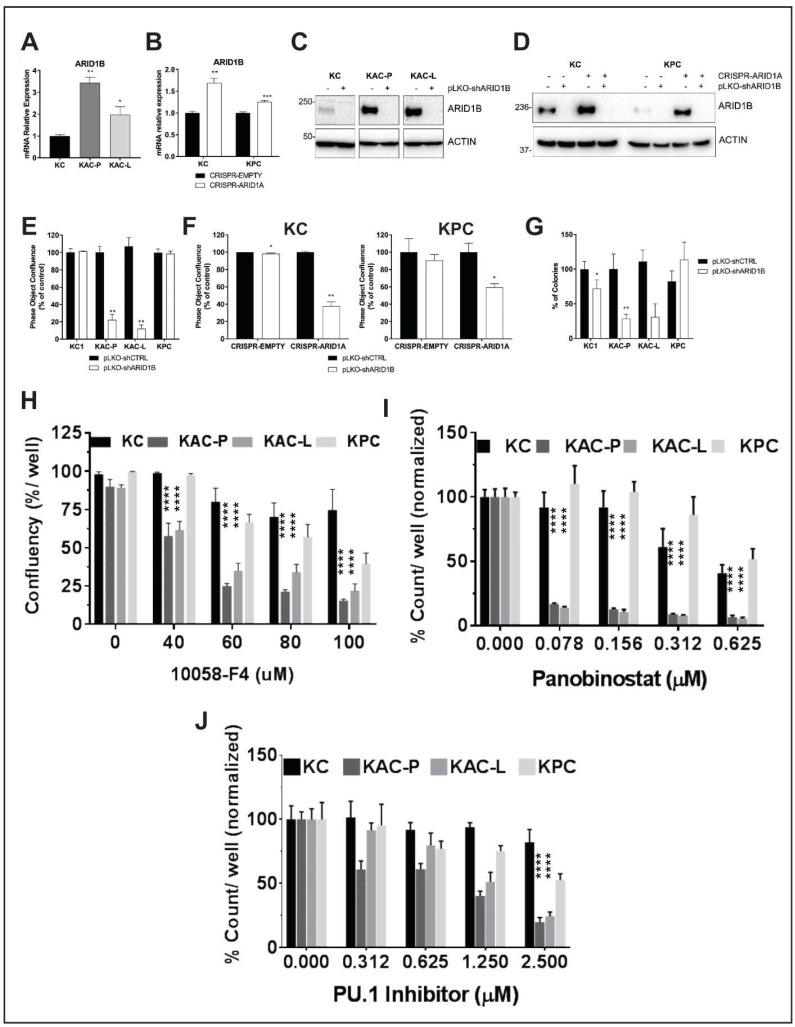
Figure 7.
Identification of synthetic lethality in autochthonous Arid1a-null PDAC cells. (A,B) Semi-quantitative RT2 PCR revealed higher Arid1b mRNA expression in Arid1a-deleted autochthonous (A) and isogenic (B) cell lines, compared to “KC” or CRISPR-EMPTY control cells, respectively. (C,D) Immunoblotting for ARID1B confirmed loss of protein expression in Arid1a-deleted autochthonous (C) and isogenic (D) cell lines after Arid1b knockdown using pLKO-shRNA. Detailed information can be found at Figure S13. (E,F) In vitro monolayer cultures of autochthonous (E) and isogenic “KC” and “KPC” (F) cell lines upon knockdown of Arid1b, showed significant reduction in proliferation, expressed as % of pLKO-shCTRL-transduced cells. (G) Anchorage-independent colony growth assay on soft-agar showed significant reduction in number of colonies upon Arid1b-knockdown, predominantly in Arid1a-deleted “KAC” cell lines. Bar graph shows the % of colonies, normalized on the pLKO-shCTRL for each cell line. (H–J) In vitro monolayer cultures of autochthonous PDAC cell lines were treated with Myc-inhibitor 10058-F4 (H), Panobinostat (I) or Pu.1 Inhibitor (J) at indicated doses for 72 h and their growth measured either as culture confluence (H) or cell count (I,J), normalized to vehicle-treated control. Images were captured every 2 h using the live-imaging system (Incucyte ZOOM) and data plotted as mean ± SD. Two-tailed unpaired Student’s t test was used for data analysis (unless otherwise indicated) and considered significant if p < 0.05; **, p < 0.01; ***, p < 0.001; ****, p < 0.0001.

