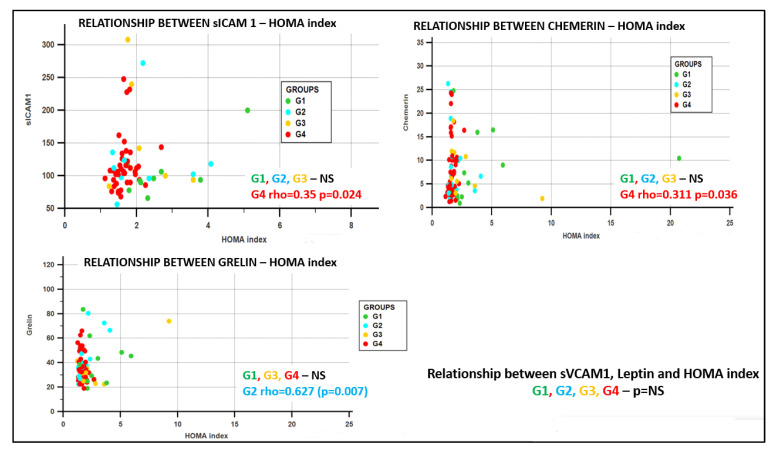
Figure 1.
Relationship between the HOMA index (homeostatic model assessment) and adhesion molecules and adipokines. Panel a: relationship between sICAM1 (soluble Intercellular Adhesion Molecule 1) and HOMA index depending on the subjects’ groups; panel b: relationship between chemerin and HOMA index depending on the subjects’ groups; panel c: relationship between ghrelin and HOMA index depending on the subjects’ groups.

