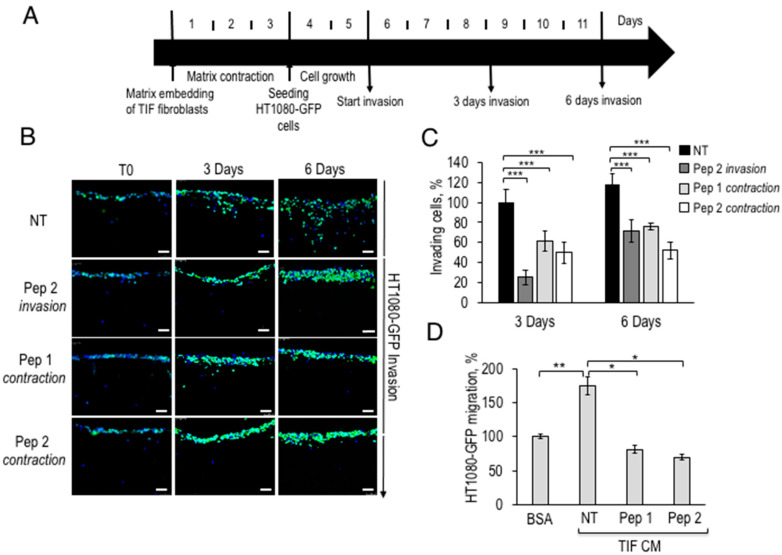
Figure 3.
Fibrosarcoma cell invasion in the presence of fibroblasts pre-exposed to Pep 1 or Pep 2 in 3D-Organotypic assays. (A) Time scale representation of the 3D-organotypic invasion assay. 5 × 10⁴ TIF fibroblasts/sample were first embedded into a neutralized collagen I solution and incubated for 3 days. Then 1 × 10⁵ HT1080-GFP cells were seeded on the matrices, grown for 2 days (T0) and let to invade for 3 or 6 days. Matrices were then processed as described in Section 4.14. (B) Representative images of matrices sections after DAPI staining, 20× magnification, Scale bar, 50 µm. Fibroblasts were processed as described in (A), in the absence of Pep 2 (NT). Duplicate samples were exposed to 100 nM Pep 2 during HT1080-GFP invasion (Pep 2 invasion) or to 100 nM Pep 1 or Pep 2 during matrix contraction (Pep 1 contraction, Pep 2 contraction) and then peptides were removed and the matrices washed twice with growth medium. During contraction or invasion peptides were added to matrices every day. (C) The number of invading cells was quantified by densitometric analysis of images shown in B, with ImageJ software, the number of HT1080-GFP invading cells on untreated matrices was normalized to T0 and the 3 days sample was considered as 100%. (D) 5 × 10⁴ TIF fibroblasts were seeded in DMEM-10% FBS in 6 well plates for 24 h, serum-starved for 6 h and incubated for 24 h in presence or in the absence of 100 nM Pep 1 or Pep 2 peptides in DMEM-10%FBS. Peptides were then removed and, after two PBS 1× washes, cells were incubated in serum-free medium for 24 h. Conditioned media (CM) from TIFs exposed to Pep 1 or Pep 2 were collected and employed as a chemoattractants for H1080-GFP cells in Boyden chamber migration assays. In each sample, 2 × 10⁴ HT1080-GFP cells were tested either toward DMEM-0.1% BSA (basal migration) or toward TIFs CM. Basal migration was taken as 100% and all values were calculated relative to that. * p < 0.05; ** p < 0.005; *** p < 0.001, Student’s t-test.

