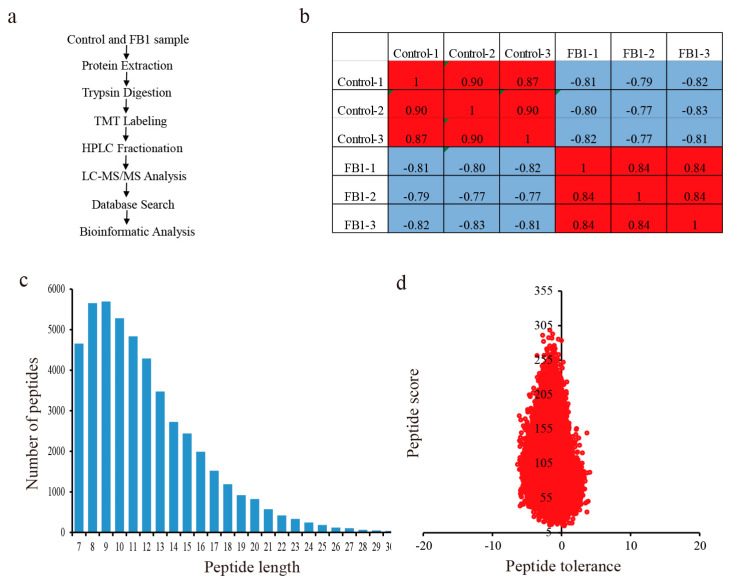
Figure 3.
Experimental strategy for the quantitative proteome analysis and the mass spectrometry data for the quality control analysis. (a) Experimental strategy for the quantitative proteome analysis. (b) Pearson correlation coefficients from all quantified proteins between each pair of samples. (c) Length distribution of all identified peptides. (d) Peptide mass tolerance distribution.

