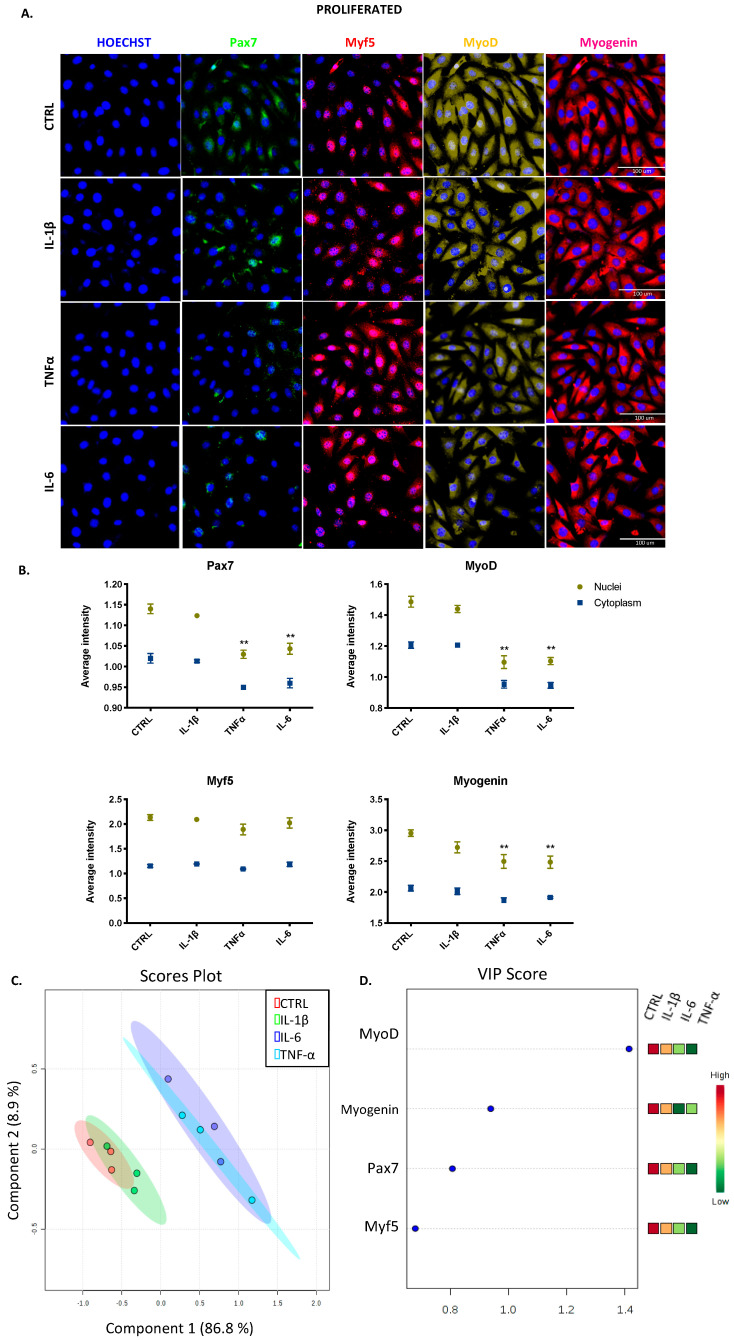
Figure 4.
Transcription factor expression for C2C12 cells at the proliferative stage. (A) Representative images of myogenic transcription factor expression obtained by high content screening (HCS) (scale bar: 100 μM). (B) The average intensity in the nucleus (yellow) and cytoplasm (blue) of every factor at basal (CTRL) and treated conditions. (C) PCA and PL-SDA score plots show the differences and similarities between treatments IL-1β (green), IL-6 (blue), and TNF-α (light blue) and the control (red). (D) Variable importance in projection (VIP) score indicates that MyoD is the most relevant factor at this stage. Data are shown as mean ± SEM (** p < 0.01 vs. control from two-way ANOVA and Dunnett’s post-test; principal component analysis (PCA) and partial least squares discriminant analysis (PSL-DA)).

