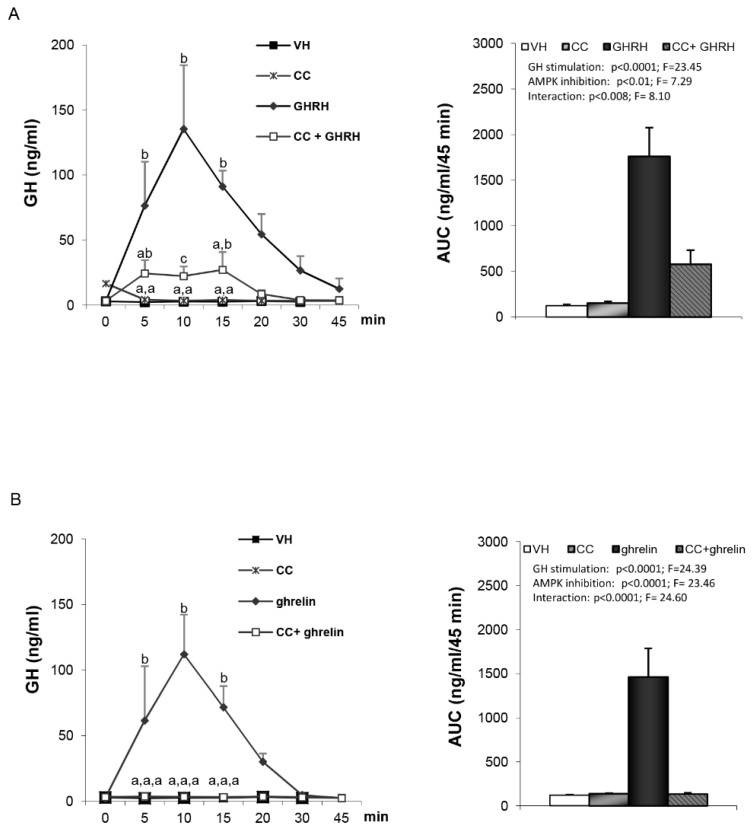
Figure 1.
Serum growth hormone (GH) profile and area under the curve (AUC) over the study period (45 min) after administration of: (A) VH (5 µL DMSO icv plus 200 µL saline iv), CC (10 µg compound C icv plus 200 µL saline iv), growth hormone–releasing hormone (GHRH) (5 µL DMSO icv plus 12 nmol/kg GHRH iv), CC+GHRH (10 µg compound C plus 12 nmol/kg GHRH iv). (B) VH (5 µL DMSO icv plus 200 µL saline iv), CC (10 µg compound C icv plus 200 µL saline iv), ghrelin (5 µL DMSO icv plus 12 nmol/kg ghrelin iv) or CC + ghrelin (10 µg compound C icv plus 12 nmol/kg ghrelin iv). Administration of the GH-stimulating peptides took place after stabilization of the animals following the third sampling point (indicated as time 0). Values are given as the mean ± SEM. p < 0.05; two-way ANOVA repeated measures followed, in case of hormone profile, by a post hoc Bonferroni’s test (groups with different superscript letters are statistically different).

