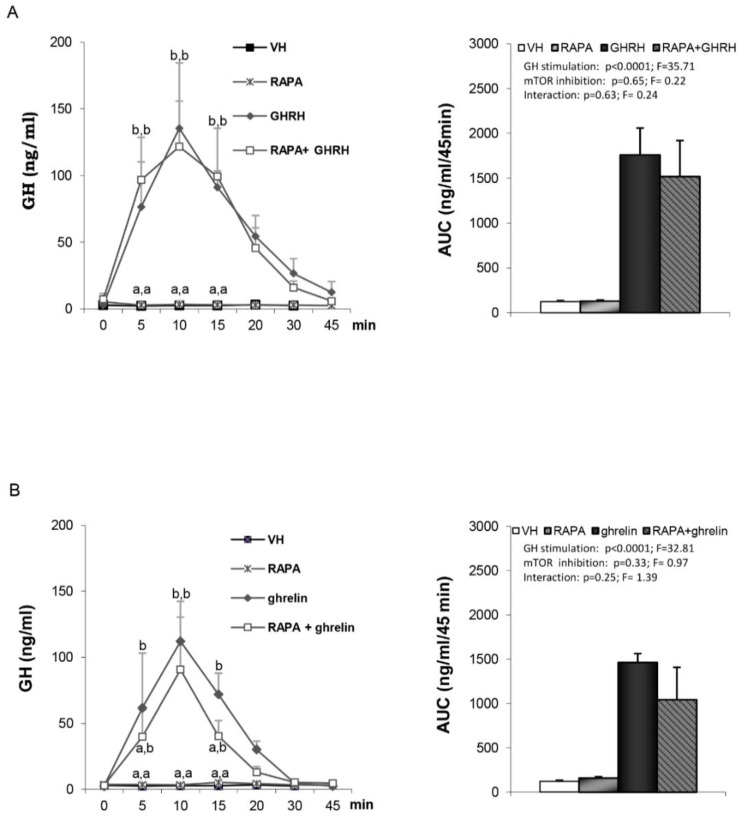
Figure 4.
Serum GH profile and area under the curve (AUC) over the study period (45 min) after administration of: Panel (A) VH (5 µL DMSO icv plus 200 µL saline iv), RAPA (50 µg rapamycin icv plus 200 µL saline iv), GHRH (5 µL DMSO icv plus 12 nmol/kg GHRH iv) or RAPA+GHRH (50 µg rapamycin icv plus 12 nmol/kg GHRH iv). Panel (B) VH (5 µL DMSO icv plus 200 µL saline iv), RAPA (50 µg rapamycin icv plus 200 µL saline iv), ghrelin (5 µL DMSO icv plus 12 nmol/kg ghrelin iv) or RAPA + ghrelin (50 µg rapamycin icv plus 12 nmol/kg ghrelin iv). Administration of the peptides took place after stabilization of the animals following the third sampling point (indicated as time 0). Values are given as the mean ± SEM. p < 0.05; two-way ANOVA repeated measures followed, in case of hormone profile, by a post hoc Bonferroni’s test (groups with different superscript letters are statistically different).

