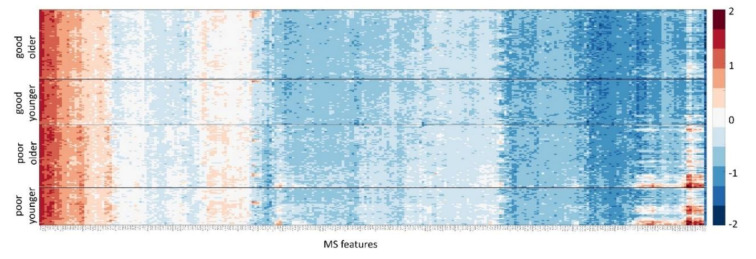
Figure 1.
Heatmap of the natural logarithm of features used in the test. Samples in the development cohort are shown as rows, grouped by test classification (good or poor) and age category (younger (age ≤ 55) and older (age ≥ 56)). Mass spectral features are shown as columns. Features and samples are hierarchically clustered.

