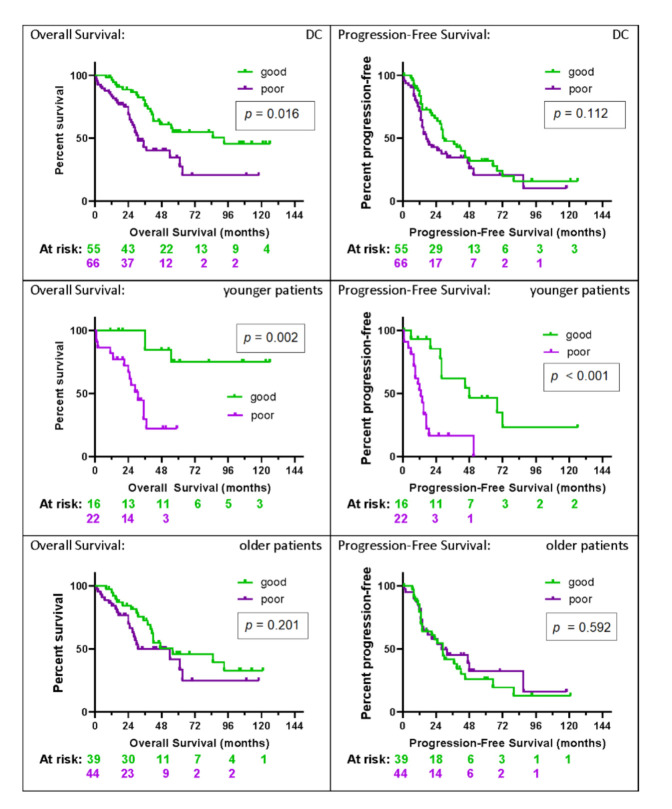
Figure 3.
KM plots by test classification of overall and progression-free survival for all patients (n = 121), younger patients (n = 38), and older patients (n = 83) with advanced-stage high-grade serous ovarian carcinoma in the development cohort. The number of patients at risk in the KM analysis at two-year intervals in each test classification group (green = good, and purple = poor) is shown below the x-axis.

