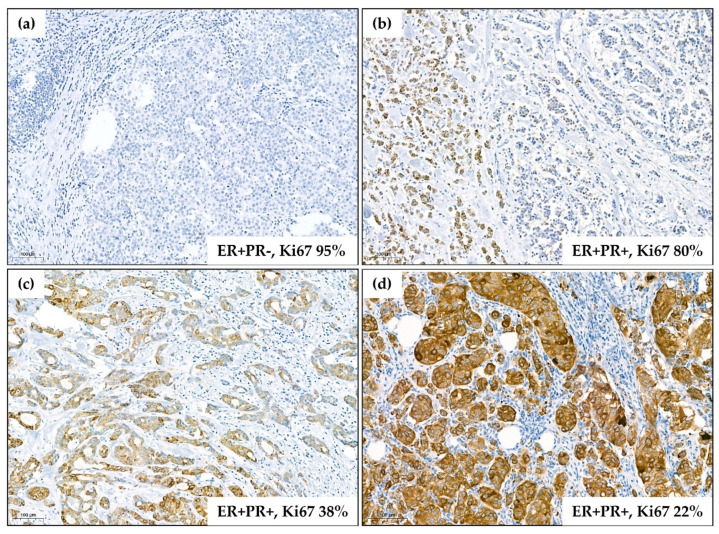
Figure 2.
Representative images of immunohistostaining for FGFR2 using H00002263-M01 antibody (Abnova). Corresponding data on hormonal receptor status and Ki67 proliferation index are presented for each tumor. The images are representative for the main observations on the links between FGFR2 levels and clinicopathological features (low levels of FGFR2 associated with ER/PR negativity and high Ki67 index). (a) Negativity of cancer cells for FGFR2 (0/3 in semiquantitative scale with H-score of 0/300); (b) weak positivity for FGFR2 (1/3 in semiquantitative scale with H-score of 80 (5 × 3 + 30 × 2 + 5 × 1 + 60 × 0)); (c) moderate positivity for FGFR2 (2/3 in semiquantitative scale with H-score of 170 (20 × 3 + 35 × 2 + 40 × 1 + 5 × 0)); (d) very strong positivity for FGFR2 (3/3 in semiquantitative scale with H-score of 290 (90 × 3 + 10 × 2)). Scale bars indicating 100 µm are applied on each image.

