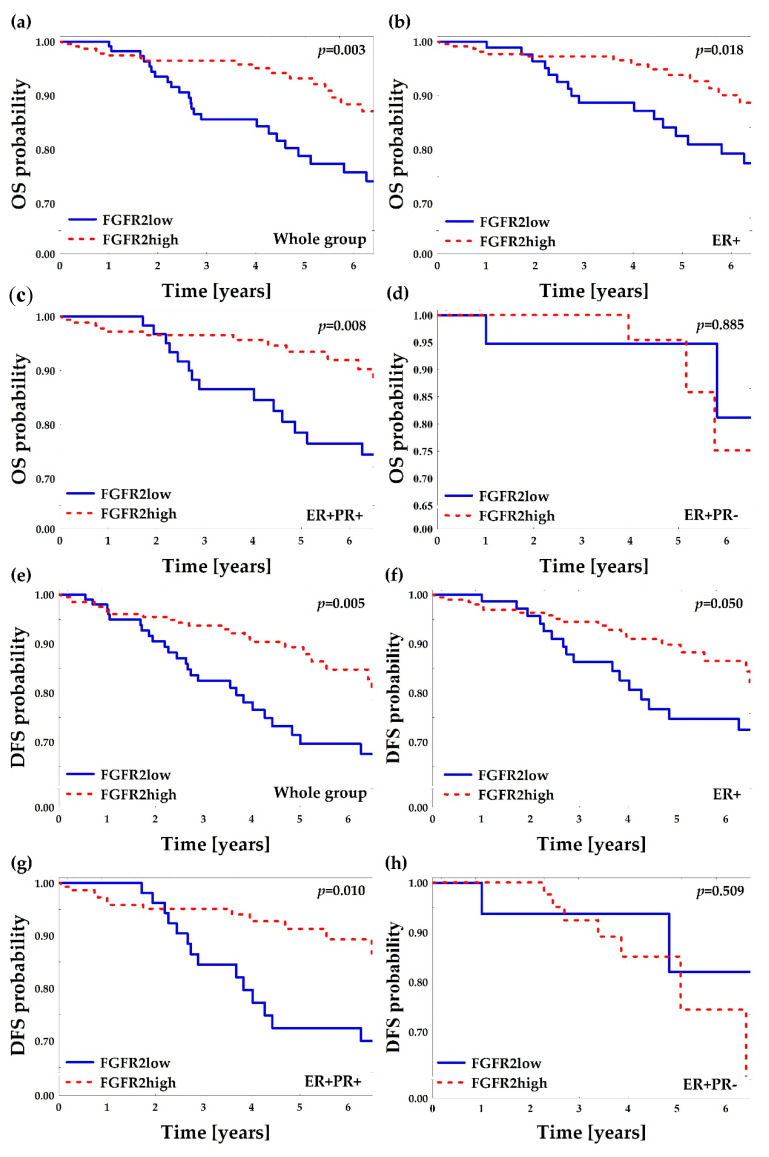
Figure 4.
Kaplan–Meier curves for overall survival (OS) and disease-free survival (DFS) probability regarding FGFR2low and FGFR2high patients (divided by 1st tercile of FGFR2 H-score). “ER+” subgroup included all ER+ patients regardless of PR status and it comprised ER+PR+ and ER+PR− subgroups. p-values were calculated using log-rank test. (a) OS in the whole group; (b) OS in the ER+ group; (c) OS in ER+PR+ group; (d) OS in ER+PR− group; (e) DFS in the whole group; (f) DFS in the ER+ group; (g) DFS in the ER+PR+ group; (h) DFS in the ER+PR− group.

