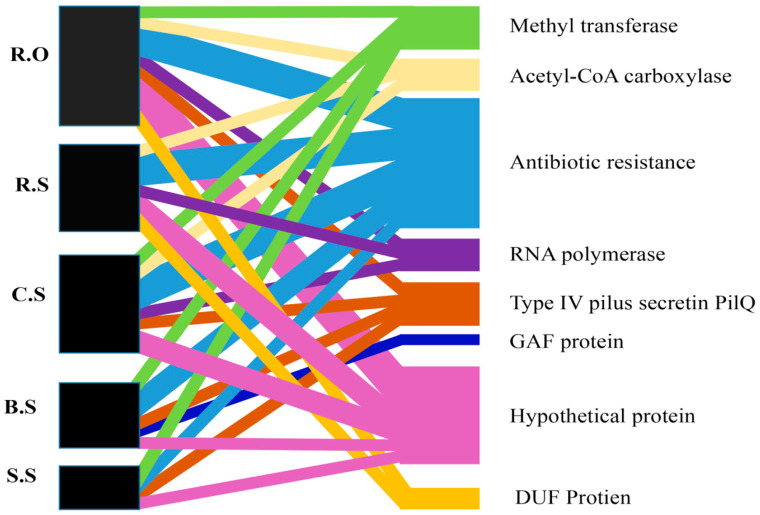
Figure 3.
The shared gene cassette networks among the sites. The black box on the left side shows the sites, and the box’s horizontal width shows the different proteins in that site. The various colors on the right side of the figure represent the different gene cassette proteins. The crossed lines of various colors between the two blocks show the presence of a specific protein, and the width of the line shows that protein’s concentration in that specific site. R.O—agriculture runoff site, R.S—rice field site, C.S—citrus field site, S.S—sugarcane field site, B.S—banana field site. The line represents the association between various sites, while the different colors represent the various GCs.

