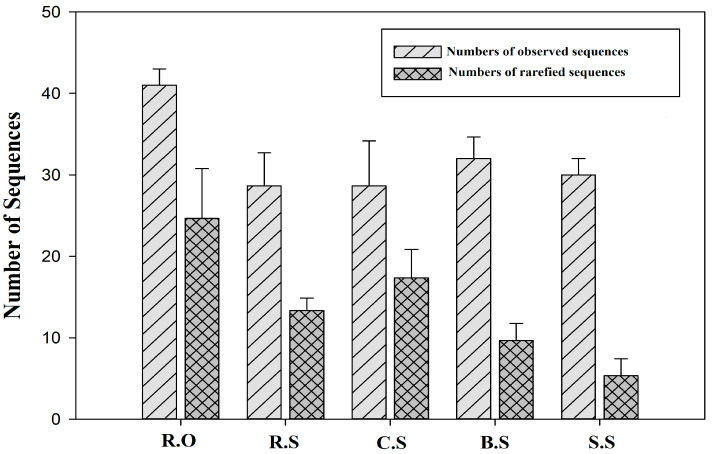
Figure 4.
Number of observed and rarefied sequences (gene cassettes in each sample. R.O—agriculture effluent site, R.S—rice field site, C.S—citrus field site, B.S—banana site, S.S—sugarcane site. Each bar on the left indicates the average observed sequences, while the bars on the right indicate the rarefied sequences based on the clone libraries. Most rarefied sequences were higher for the R.O site, while the lowest numbers were found for the S.S site.

