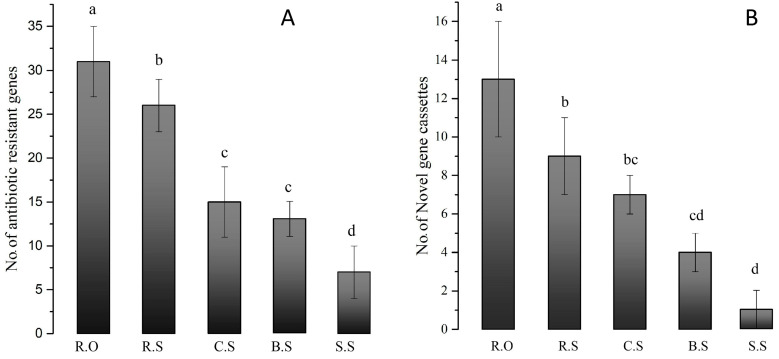
Figure 6.
Numbers of antibiotic resistance genes (A) and novel GCs (B) observed in each sample. R.O—agriculture effluent site, R.S—rice field site, C.S—citrus field site, B.S—banana site, S.S—sugarcane sites. Different letters indicate different significant differences, while the error bars show the standard errors. Different letters (a, b, c, d) above the column indicate statistical significance at p values < 0.05. The highest number of antibiotic resistance GCs and novel GCs was found for the R.O site, and the lowest numbers were found for the S.S site.

