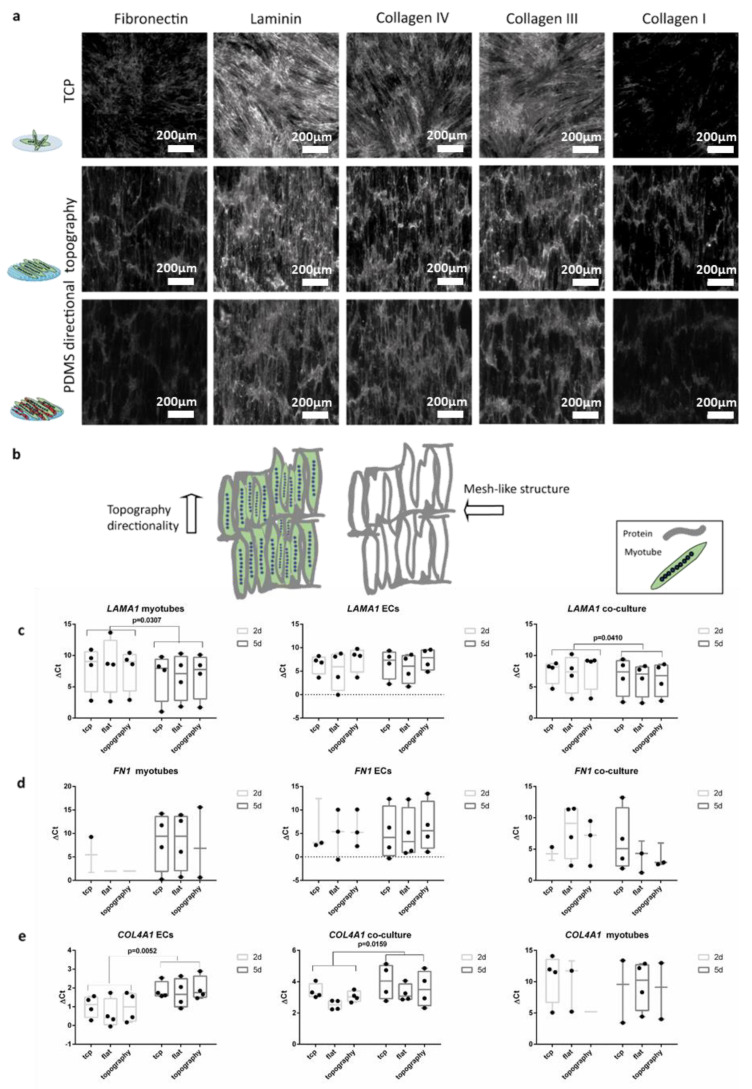
Figure 5.
ECM deposition follows the cell’s directionality indifferently of the substrates: (a) (top) Micrographs (1 mm × 1 mm) of five-day-old myotubes in TCP; (middle) myotubes on wrinkled PDMS; and (bottom) two-day co-culture (five-day-old myotubes and two-day-old ECs). Scale bars are 200 µm. (b) Cartoon depicts the directionality of the topography of the micrographs and the pattern of the protein’s deposition. (c) Myotube monocultures and co-cultures with ECs showed LAMA1 expression increased by two-fold change (paired t-test p = 0.0307 and p = 0.0410) between the two-day co-culture (five-day-old myotubes) and five-day co-culture (seven-day-old myotubes). (d) Gene expression of FN1. (e) ECs and their co-culture with myotubes showed a decreased COL4A1 expression over time from two days of culture to five days of co-culture (paired t-test p = 0.0052 and p = 0.0159, respectively). ΔCt was calculated subtracting the value of the gene of interest minus the value of the reference gene HPRT. Data points represent each independent experiment (n = 4). If expression was below the detection limit, data points are not shown in the graphs.

