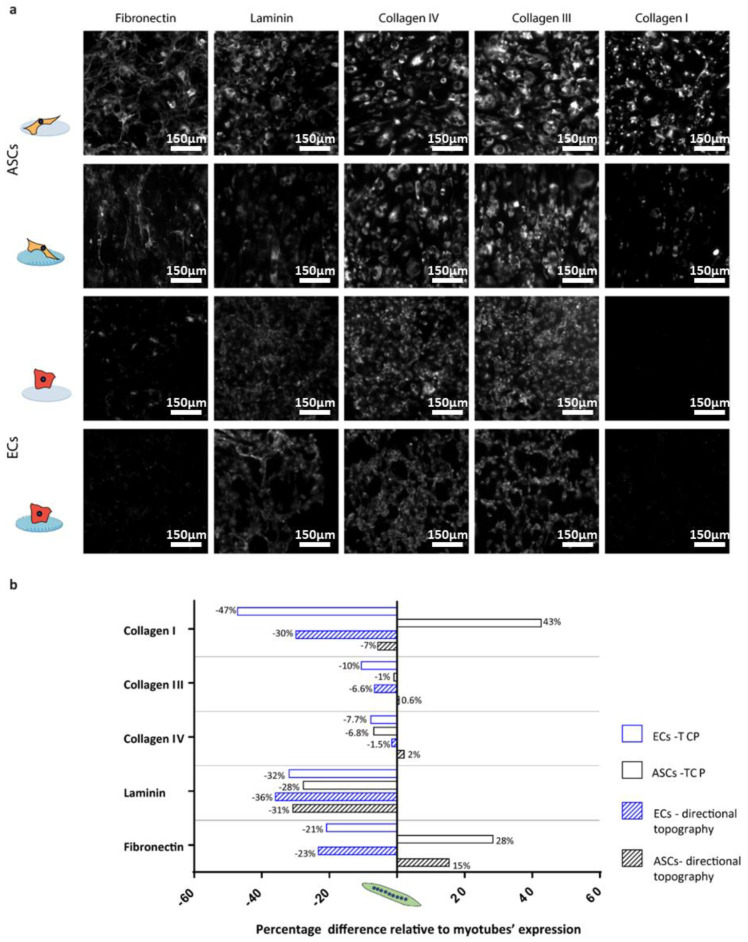
Figure 6.
Percentage difference relative to myotubes expression: (a) Deposition of matrix protein of monocultures of ASCs and ECs on TCP and PDMS directional topographical surfaces after two days in culture. Scale bars are 150 µm. (b) Quantified fractions of deposited ECM protein, where negative means lower deposition by ECs or ASCs, while positive means lower deposition by myotubes. All depositions were compared to five-day-old myotubes (normalized with integrated density of the myotubes on TCP and directional topography).

