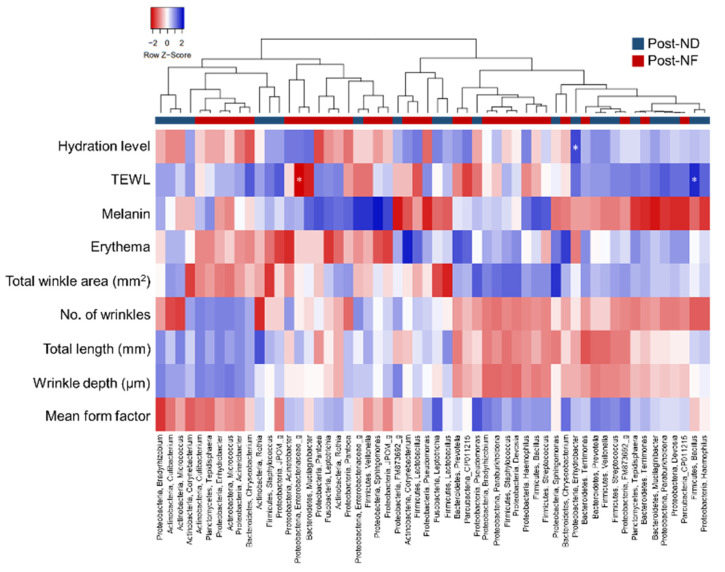
Figure 7.
Pearson’s correlation analyses of skin microbiota with clinical parameters after treatment of serum cosmetics with/without GOS. Correlations of significant genes expression in ND and NF group with clinical parameters and skin microbiota are shown by using heat map. * Pearson’s correlation values with p < 0.05. ND (control serum); NF (cosmetic serum containing GOS).

