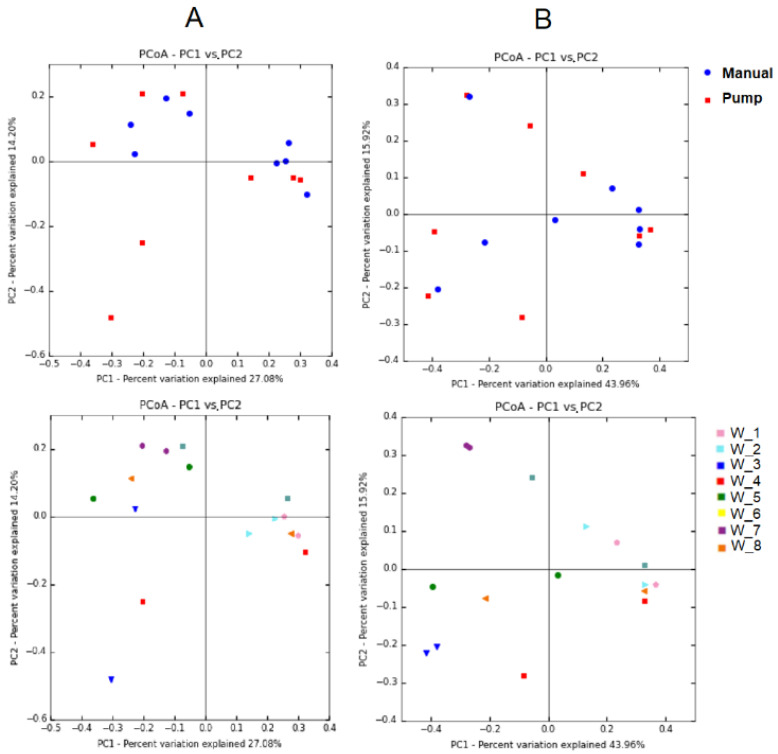
Figure 2.
PCoA plots of bacterial profiles (at operational taxonomic unit (OTU) level) based on the Jaccard’s coefficient for binary data (presence/absence) (A) and on the Bray–Curtis similarity analysis (relative abundance) (B) of the milk samples collected from women 1 to 8. The value given on each axis label represents the percentage of the total variance explained by that axis. In the upper figures, color and shape of the symbol indicate the collection method (red squares, pump using a single-use device; blue circles, manual expression). In the bottom figures, different colors of the symbols represent the samples provided by each woman, independently of the collection method.

