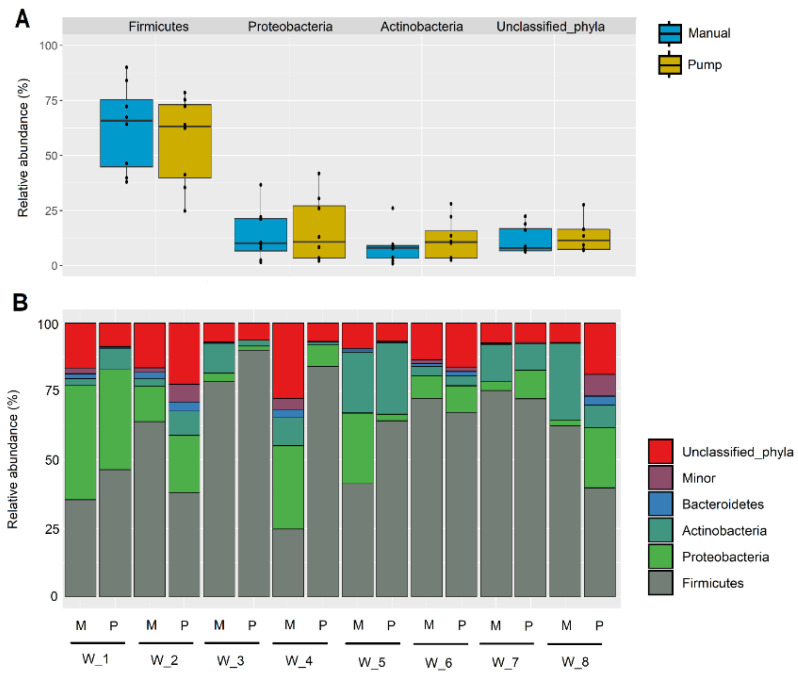
Figure 3.
(A) Comparison of the relative abundance of sequences (%) belonging to main bacterial phyla obtained by metataxonomic analysis from milk samples obtained using a pumping device (blue) or by manual expression (yellow). (B) Individual profile of the relative abundance of the most abundant phyla in the milk samples provided by each woman (n = 8; W_1 to W_8) using two collection methods: manual expression (M) or using a pumping device (P).

