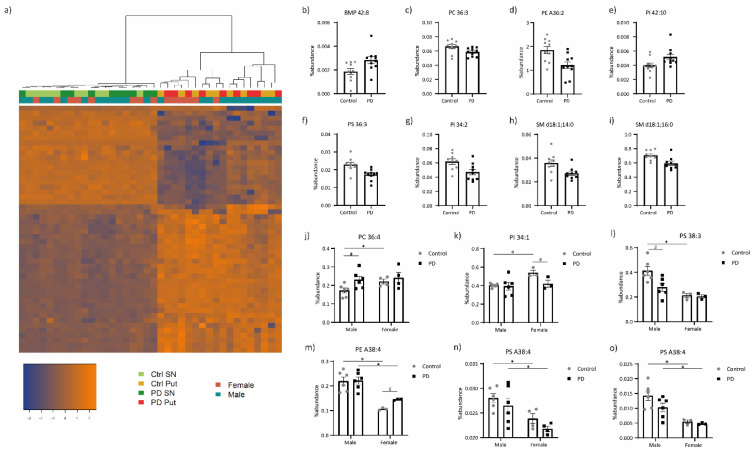
Figure 1.
Lipid profiling of the SN and putamen from PD patients compared to controls. (a) Hierarchical clustering of the samples based on the different abundances of lipid species. Percentage of abundance of lipid species that differ between PD patients and controls, according to at least two of the three selection criteria, in (b–f) SN and (g–i) putamen, and between male and female controls, and also in (j) SN and (k) putamen of male PD patients compared to controls, or in (l) putamen of female PD patients compared to controls. Percentage of abundance of a lipid that (m) has different abundances in both males and female controls, and male and female PD patients, together with a difference in female PD patients compared to controls, and that is lower in females than in males, both in controls and PD patients, in (n) SN and (o) putamen. BMP, Bis(Monoacylglycero)Phosphate; PC, phosphatidylcholine; PE, phosphatidylethanolamine; PI, phosphatidylinositol; PS, phosphatidylserine and SM, sphingomyelin, where d18:1 indicates the common sphingosine base c.f. standard nomenclature [45]. Sample values are plotted individually. ‘A indicates that the sn-1 position is linked via an ether linkage. Numbers (X:Y) represent the number of carbons (X) and double bonds (Y). # Differences between control and PD samples, within one gender; * differences between male and female samples, within one condition.

