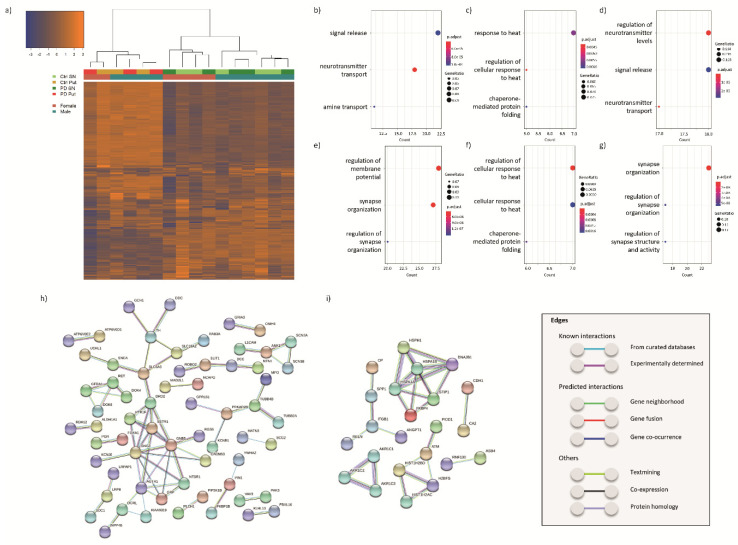
Figure 2.
Transcriptomic analysis of the SN and putamen from PD patients compared to controls. (a) Hierarchical clustering of the samples based on the transcriptomic results; biological pathways enriched in (b) all, (c) upregulated and (d) downregulated DEGs found in our RNA-seq analysis of SN and in (e) all, (f) upregulated and (g) downregulated DEGs from the overlap between previous microarray mRNA expression profiling studies on SN from PD patients and controls (GSE7621, GSE42966, GSE49036, GSE20164, GSE20163, GSE20333 and GSE54282), including also the present study; interaction networks of proteins encoded by genes (h) downregulated or (i) upregulated in at least two of the eight studies included in the overlap analysis. Protein–protein networks were obtained with STRING [31]. Only the highest confidence associations were included. Non-connecting nodes were removed.

