Figure 4.
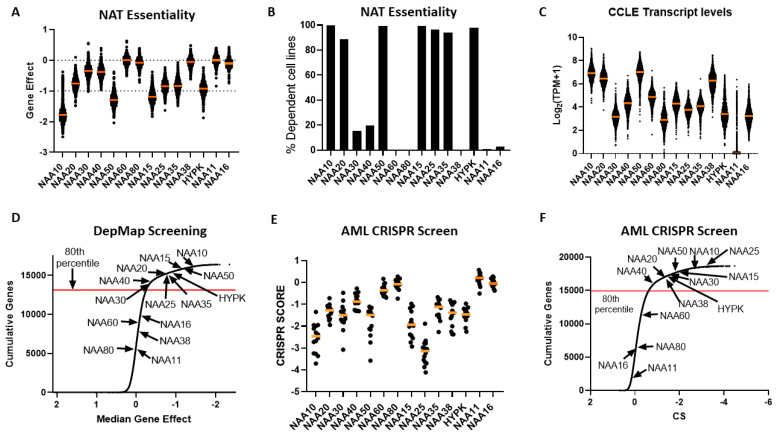
Dependency of cancer cells on functional NAT complexes. (A) Gene effect (CEREC) of CRISPR-CAS KO of human NAT catalytic and auxiliary genes across 739 cell lines. More negative values indicate greater sensitivity to KO. Each cell line is represented by a circle symbol, and the median gene effect across all cell lines is depicted by an orange line; (B) Percentage of cell lines with CRISPR-CAS KO data which were deemed as dependent on NAT gene, as calculated in DepMap database; (C) Transcript levels for NAT genes across CCLE study. The orange line represents the median of transcript level across the CCLE panel; (D) Cumulative frequency for median gene effect for all examined genes in DepMap CRISPR-CAS KO dataset. Arrows indicate the position of NAT catalytic subunits on this curve; (E) Scatterplot of CRISPR scores for NAT catalytic genes in study of 14 Acute Myeloid Leukaemia (AML) cell lines. Each circle symbolises a cell line and orange line depicts median CRISPR score. Lower CRISPR scores indicate greater sensitivity to KO; (F) Cumulative frequency for median gene effect for all examined genes in AML CRISPR KO dataset. Arrows indicate the position of NAT catalytic subunits on this curve.

