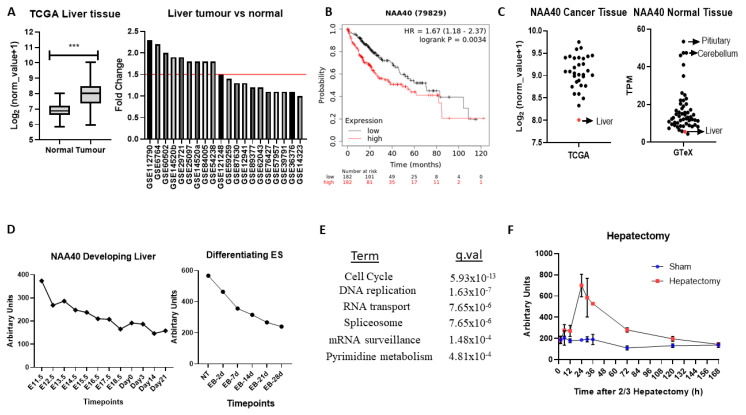
Figure 5.
NAA40 is associated with liver proliferation and cancer. (A) NAA40 transcript comparison between normal and tumour liver tissue in TCGA (left panel) and 20 studies from GEO omnibus (right panel); (B) KM plot for liver cancer, with samples divided according to median NAA40 expression; (C) Transcript levels of NAA40 in TCGA pan-cancer (left panel) and GTeX study (right panel). Each circle represents mean transcript value of one tissue type, with arrow indicating relative levels of liver; (D) Timecourse of NAA40 transcript levels in developing liver (left panel) and in Embryonic Stem (ES) cells differentiating to hepatocytes (right panel); (E) KEGG enriched terms among 1000 top co-expressed genes in 107 liver cancer datasets (q < 0.001); (F) Time course of NAA40 transcript levels in regenerating liver following 2/3 hepatectomy. *** p <0.001 Student’s t-test.

