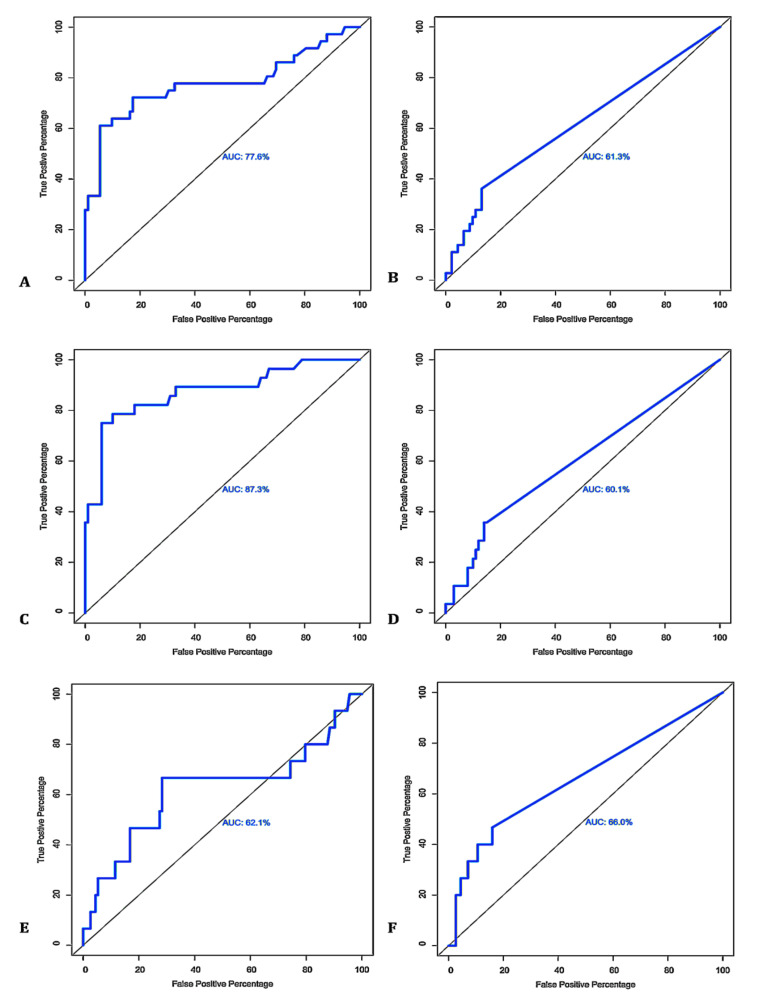
Figure 10.
Receiver operating characteristic (ROC) curve analysis and corresponding area under the curve (AUC) analysis of MELISA (A,C,E) and MqPCR (B,D,F) datasets. The sensitivity and specificity of the MELISA and MqPCR tests in the detection of MAP in 128 MIF milk samples were evaluated based on three different gold standards of SELISA and FPCR (A,B), SELISA (C,D), and FPCR (E,F).

