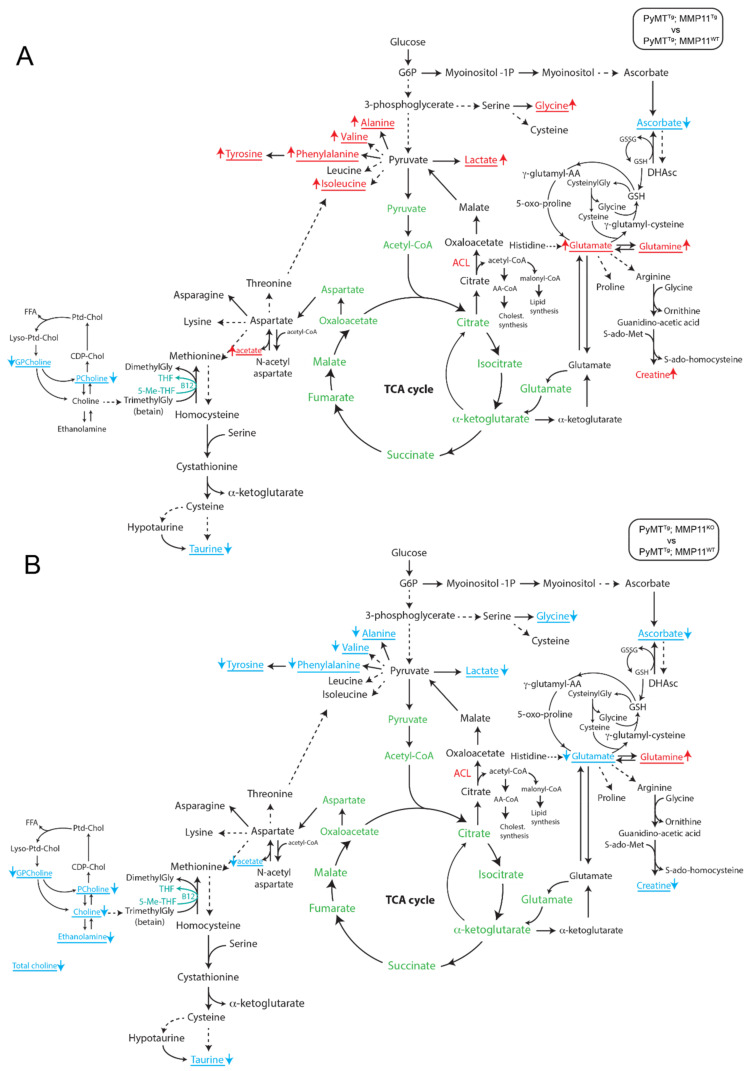
Figure 6.
Results of the algorithm to determine the expected metabolite level alterations (ADEMA) network analysis of NMR high resonance magic angle spinning (HRMAS) metabolomics profile of mammary gland tumors in mice: (A) between PyMTTg; MMP11Tg mice compared to PyMTTg; MMP11WT controls and (B) between PyMTTg; MMP11KO compared to PyMTTg; MMP11WT controls. The metabolites underlined and written with an arrow for each one indicate the metabolites that are predicted to increase and decrease in PyMTTg; MMP11Tg (A) or PyMTTg; MMP11KO (B). The metabolites in green are present in the mitochondria. GSH: reduced glutathione; GSSG: oxidized glutathione; DHAsc: dehydroascorbate; g-glutamyl-AA: g-glutamyl-amino acid; Gly: glycine; ACL: ATP citrate lyase; AA-CoA: acetoacetyl-CoA.

