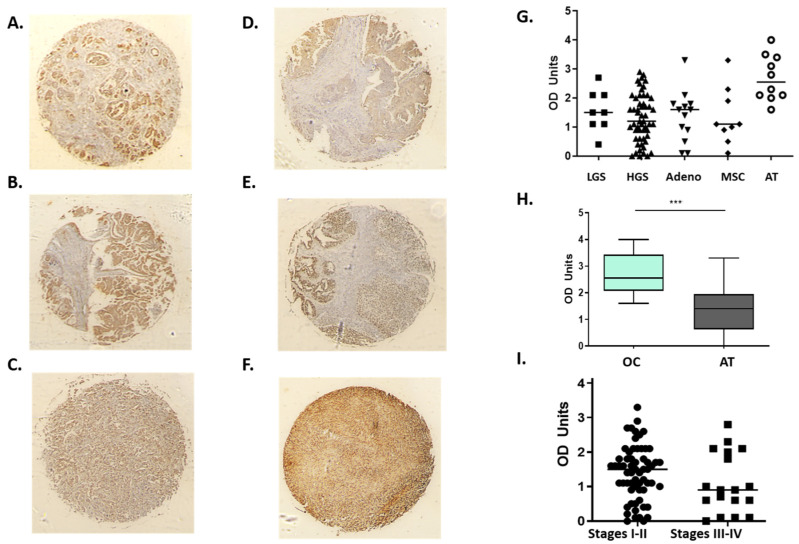
Figure 7.
Staining of OC cores with H2AX. (A): Low grade serous (LGS), (B): High grade serous (HGS), (C): Mucinous adenocarcinoma (Adeno), (D): Metastatic serous carcinoma (MSC), (E): Endometrial adenocarcinoma, and (F): adjacent to tumour ovarian tissue (NAT). Abundance of staining was detected across all different OC types with an upregulation in NAT tissue (G). Significant protein upregulation of H2AX (*** p = 0.0003) when all OC cores were compared to NAT (H). Non-significant difference in H2AX staining between late (III and IV) and early stage (I and II) (I).

