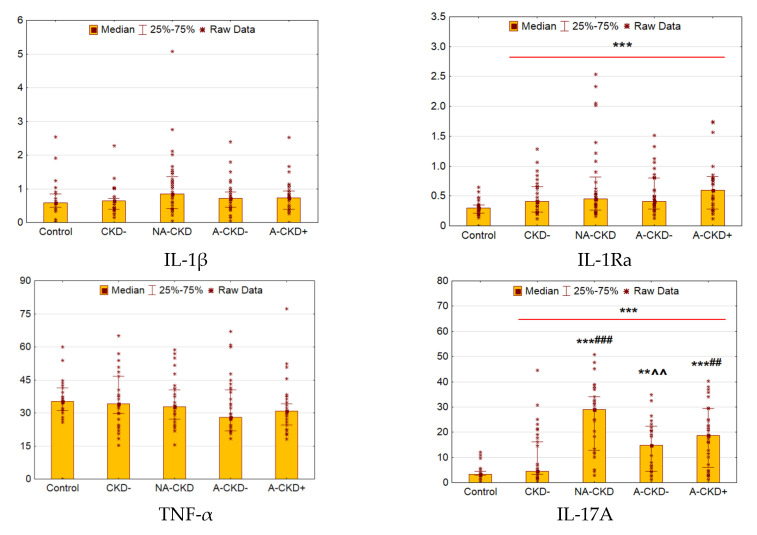
Figure 5.
Serum concentrations of IL-1β (pg/mL), IL-1RA (ng/mL), TNF-α (pg/mL) and IL-17A (pg/mL). CKD−: The group of individuals with estimated glomerular filtration rate (eGFR) ≥60 mL/min/1.73 m2 and urinary albumin-to-creatinine ratio (UACR) <3.0 mg/mmol; NA-CKD: Non-albuminuric chronic kidney disease, the group of individuals with eGFR <60 mL/min/1.73 m2 and UACR <3.0 mg/mmol; A-CKD−: Group of patients with eGFR ≥60 mL/min/1.73 m2 and UACR ≥3.0 mg/mmol; A-CKD+: Group of individuals with eGFR <60 mL/min/1.73 m2 and UACR ≥3.0 mg/mmol. ** p < 0.01, *** p < 0.001 vs. control, ## p < 0.01, ### p < 0.001 vs. CKD−; ^^ p < 0.01 vs. NA-CKD; Mann–Whitney and Kruskal–Wallis test, Holm’s step-down procedure.

