Figure 1.
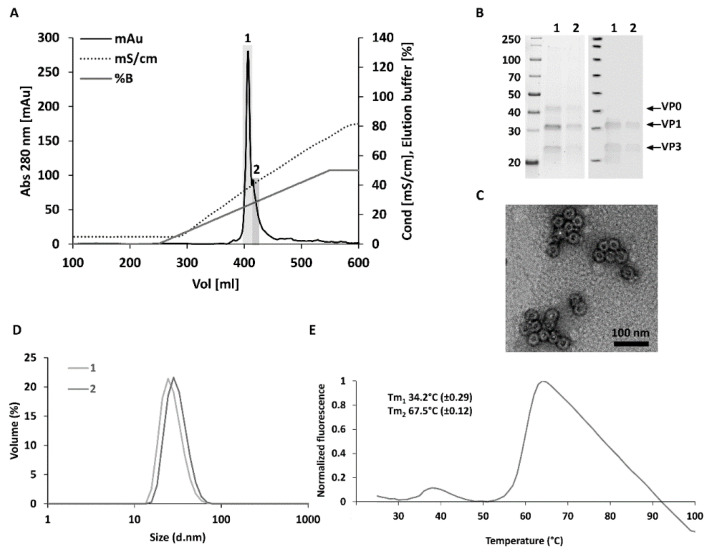
Purification and characterization of VLP. Final cation exchange chromatography concentration step and characterization of the purified CVB3-VLPs with SDS-PAGE, Western blotting, TEM, DLS and DSF. (A) In the final cation exchange chromatography step, the VLP was loaded on the column in a buffer containing 20 mM Tris pH 7.4, 5 mM MgCl2, 20 mM NaCl and 0.1% Tween80. Captured VLPs eluted in an approximately 250 mM NaCl concentration using a linear gradient into two fractions designated 1 and 2 (fraction 1 represented the most concentrated fraction and fraction 2 the more dilute side fraction; (B) SDS-PAGE and Western blot analyses of purified VLPs. The left panel shows the stainfree total protein staining of the purified CVB3-VLP fractions 1 and 2. The right panel shows VP1 and VP3 capsid protein detection by Western blot using an in-house produced rabbit anti-CVB1-6 polyclonal antibody; (C) Transmission Electron Microscopy (TEM) image of the chromatography purified CVB3-VLP. Scale bar 100 nm, 50,000× magnification. (D) Dynamic light scattering (DLS) analysis of the purified CVB3-VLP fractions. (E) Thermal stability profile of CVB3-VLP with differential scanning fluorimetry (DSF). Fluorescence intensity of the dye in the presence of VLPs was plotted as a function of the temperature, and melting temperatures (Tm) of the VLPs were derived from the inflection points of the transition curve using the Boltzmann equation [36]. The data is shown as an average of three independent measurements ± Standard Deviation.

