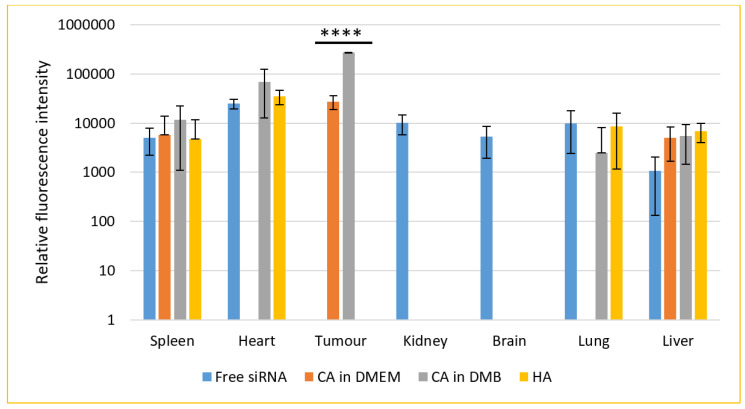
Figure 15.
Biodistribution of CA-in-DMEM, CA-in-DMB and HA in a mouse model of breast cancer. NPs loaded with fluorescence siRNA were injected into tumor-bearing mice via tail vein. After 4 h, the animals were sacrificed and organs were collected and lysed. The tissue lysates were centrifuged at 8000 rpm for 20 min. Fluorescence was measured for the supernatants. Each group contained 5 animals. Background fluorescence was measured using the organ and tumor lysates of untreated mice and the measured values were deducted from those of treated groups. Data were presented as average ± S.D. and the graph was plotted in logarithmic scale. **** Values for two CAs accumulated in tumor tissues were significantly different at p < 0.0001 level. No NPs were detected in kidneys or brain. CA-in-DMEM was not detected in heart and lungs. Spleen and liver showed presence of free siRNA as well as NPs. However, there was no significant difference.

