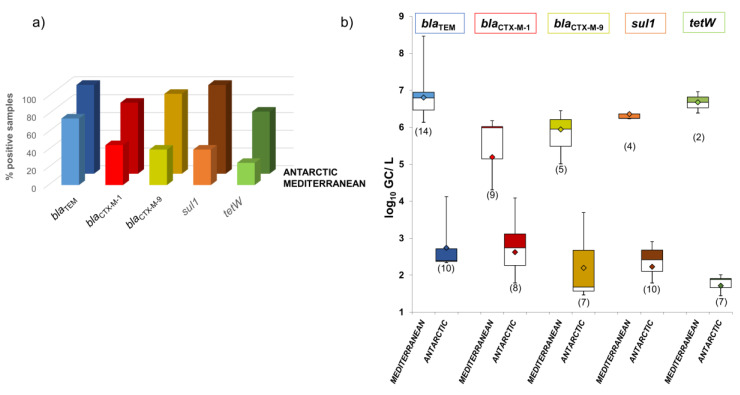
Figure 2.
Antibiotic resistance genes (ARGs) in phage particles in Mediterranean and Antarctic seawater samples. (a) Percentage of positive samples for each ARG. (b) Abundance of each ARG in seawater (log10GC/L). Data are represented in boxplots; the diamond represents the average value of the positive samples, the upper squares include samples whose values are within the 75th percentile, and those in the lower white boxes are within the 25th percentile.

