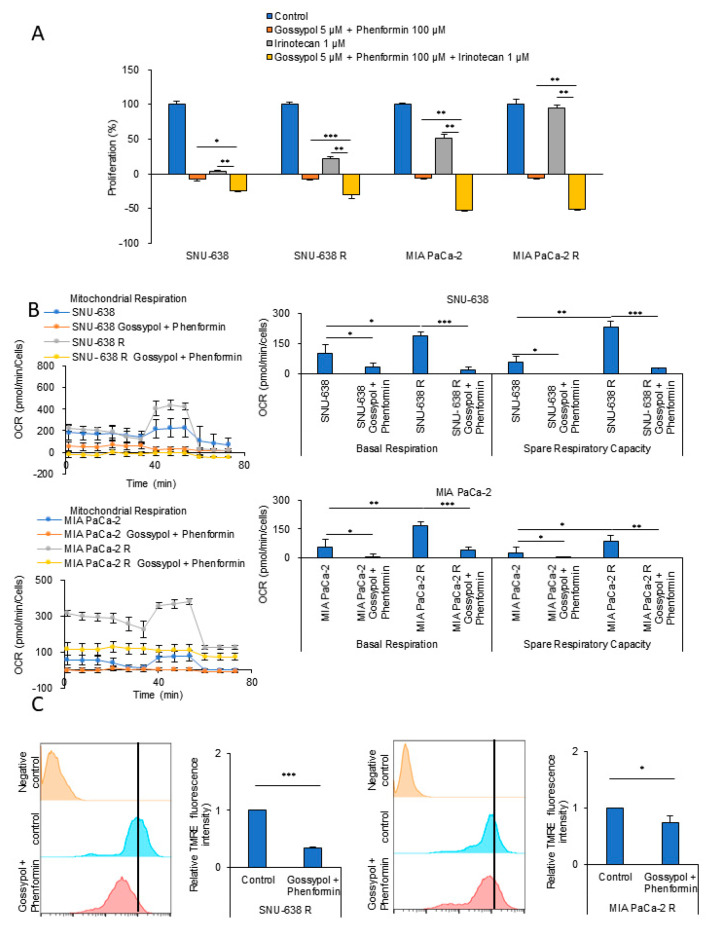
Figure 3.
OxPhos inhibition reverses anticancer drug resistance. (A) Cell proliferation was assessed using the SRB assay. Wild-type (SNU-638, MIA PaCa-2) and drug-resistant cancer cells (SNU-638 R, MIA PaCa-2 R) were treated with the OxPhos inhibitors phenformin (100 μM) and gossypol (5 μM) for 48 h (n = 3). (B) The OCR was analyzed in wild-type and drug-resistant cancer cells after treatment with the OxPhos inhibitors phenformin (100 μM) and gossypol (5 μM) for 24 h (SNU-638; n = 3, MIA PaCa-2; n = 3). (C) The mitochondrial membrane potential was measured by TMRE staining in SNU-638 R and MIA PaCa-2 R cells before and after treatment with phenformin (100 µM) and gossypol (5 µM) for 24 h (n = 3). Error bars represent the mean + s.d. *, p < 0.05; **, p < 0.01; ***, p < 0.001. P values were analyzed by unpaired two-tailed Student’s t test.

