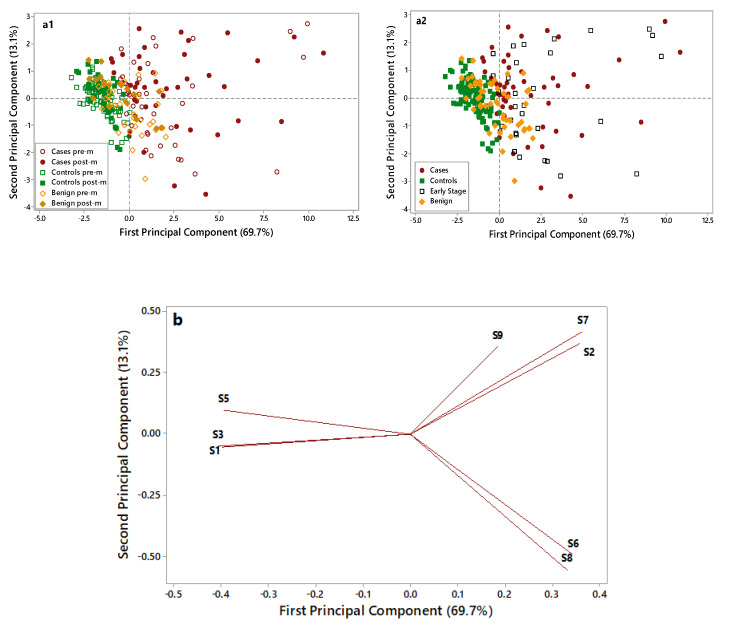
Figure 3.
Principal Component Analysis(PCA) score plots (a1,a2) and loading plot (b) of electronic nose data collected on control (green), benign (yellow), and case (red) samples. In the score plot (a1) empty symbols are for premenopausal (pre-m) patients, and full symbols are for postmenopausal (post-m) patients. In the score plot (a2) empty black symbols are for early-stage patients. Two score pots were elaborated to: i. discriminate premenopausal and postmenopausal patients (Figure 3(a1)). ii. evaluate the plot distribution for early-stage ovarian cancer (OC) patients (Figure 3(a2)).

