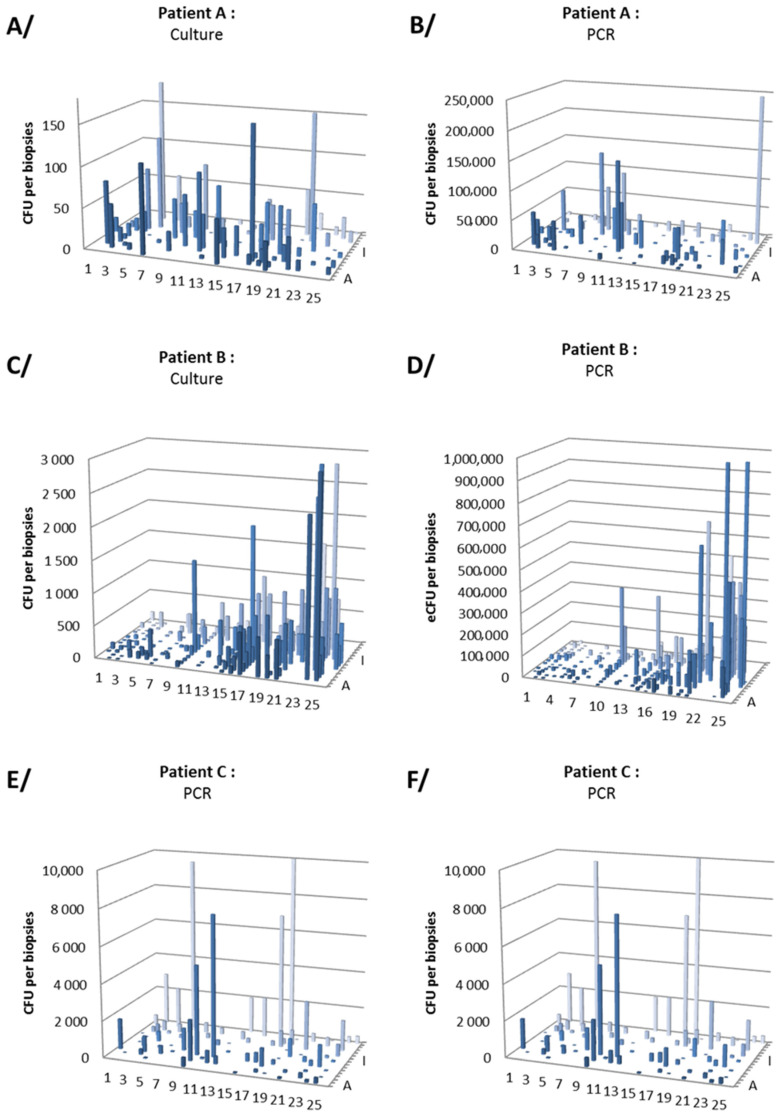
Figure 1.
Quantitative distribution of Helicobacter pylori in the stomach of three patients. (A,B) correspond to patient A; (C,D) to patient B; (E,F) to patient C. (A,C,E) correspond to bacterial quantification using culture method in CFU/biopsy and (B,D,F) to qPCR method in eCFU/biopsy. Colors are only meant to clarify the visualization of the charts.

