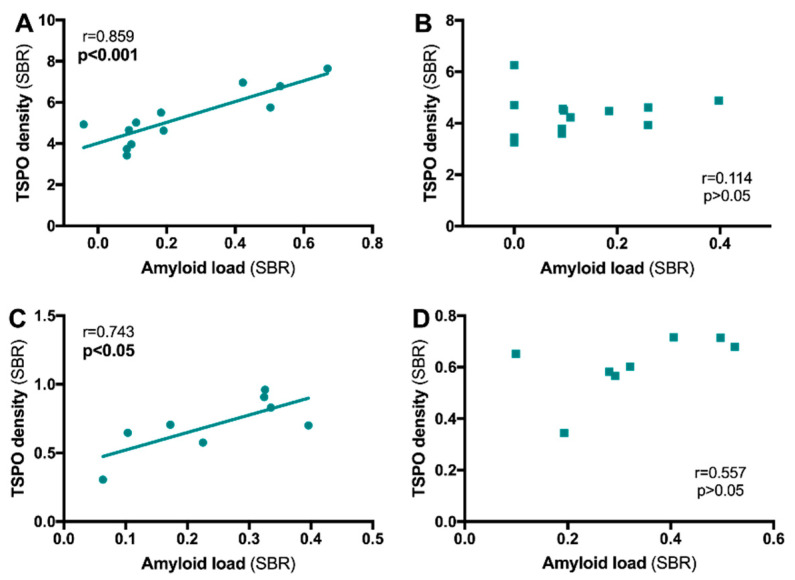
Figure 6.
Relationship between TSPO density and amyloid load in the hippocampus of 3xTg-AD mice and TgF344-AD rats. TSPO density and amyloid load were determined by in situ autoradiography with [125I]CLINDE and [125I]DRM106 in 3xTg-AD mice (A,B) and TgF344-AD rats (C,D). A positive correlation was observed in the dorsal hippocampus (A,C) but not in the ventral hippocampus (B,D). r = Spearman’s correlation coefficient. Mouse data were published in Reference [101], and rat data are personal observations.

