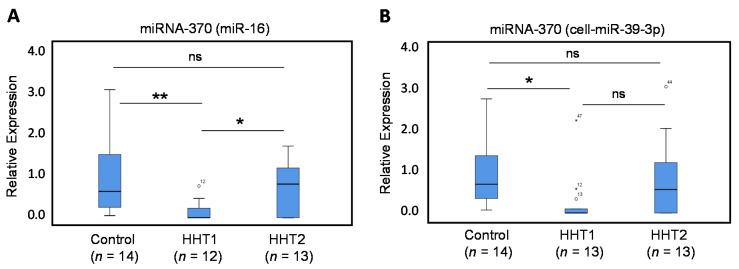
Figure 1.
Quantitative Reverse Transcriptase–Polymerase Chain Reaction (qRT-PCR) of miRNA-370. Total plasma RNA was isolated from HHT1 and HHT2 patients and control subjects. Relative expression levels of miR-370 were measured by qRT-PCR using miR-16 (A) or cel-miR-39-3p (B) as normalizers. The number of samples analyzed is indicated in parentheses. Symbols outside the box plot represent extreme values (°) and outliers (*) with their corresponding sample numbers. Experiments were performed in triplicates. (* p < 0.05; ** p < 0.01; ns, not significant).

