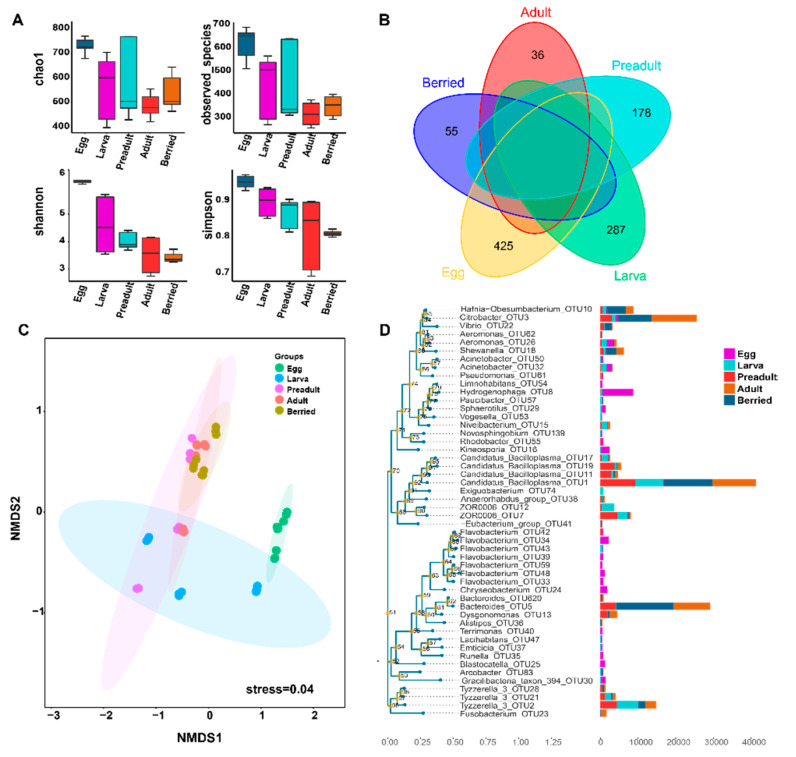
Figure 3.
Trajectory of the gut microbiota in crayfishes across developmental stages. (A) The α-diverdity indexes (including observed species, Chao1, Shannon and Simpson) of crayfish during developmental stages. (B). Venn diagram showing OUT numbers change according to sample types. (C) Non-metric Multi-Dimensional Scaling ordination (NMDS) showing that bacterial communities cluster by sample types using the unweighted UniFrac distance. Adonis test, R2 = 0.382, p = 0.001. (D) The phylogenetic tree of top 50 OTUs relative to the relative abundance.

