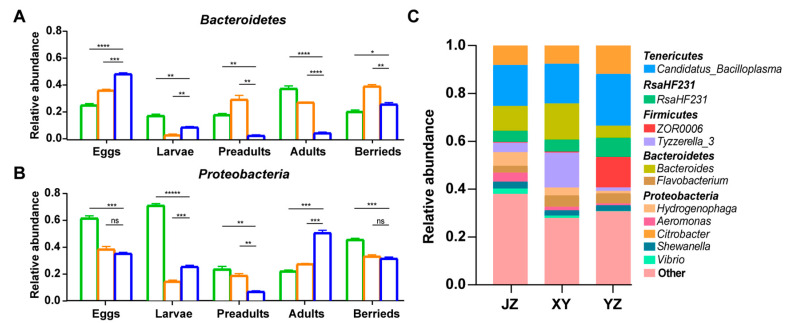
Figure 7.
Changes of Bacteroidetes and Proteobacteria during developments. The relative abundance of Bacteroidetes (A) and Proteobacteria (B) phyla. Green bars: samples from Jingzhou; orange bars: samples from Xuyi; blue bars: samples from Yangzhou. (C) The composition of gut microbiota from three locations at the genus level. Significance: * p < 0.05, ** p < 0.01, *** p < 0.001, **** p < 0.0001, ***** p < 0.00001, one-way ANOVA.

