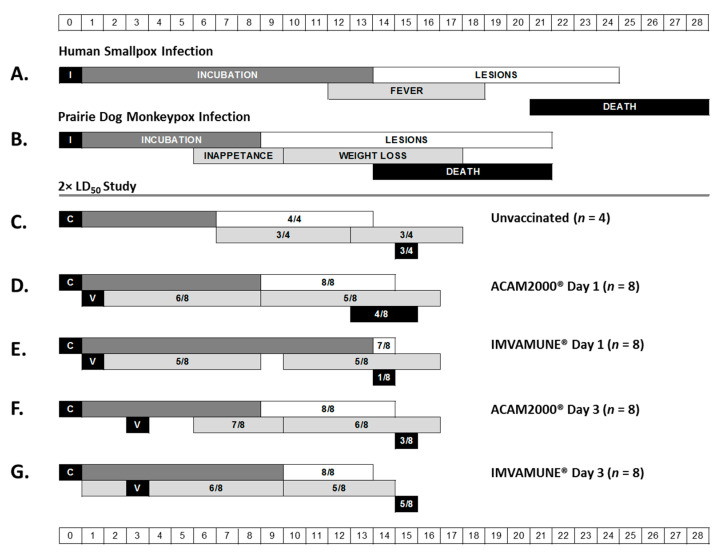
Figure 1.
Clinical disease progression. This schematic presents a comparison of the timing of major stages of disease progression in natural human smallpox infection (A) and natural prairie dog monkeypox infection (B). The major disease stages captured include infection (I) or challenge (C), incubation (dark gray bar), febrile prodrome (light gray bars), rash (white bar), and endpoint (black bar). For human smallpox infection, the prodromal symptom represented is fever. For prairie dog monkeypox infection, the prodromal-like symptoms represented are inappetence (left light gray bar) and weight loss (right light gray bar). Endpoint represents either resolution of lesions/survival or death. The remaining rows show the results of the 2× LD50 study for unvaccinated animals (C), animals vaccinated (V) on Day 1 with ACAM2000® (D) or IMVAMUNE® (E), or animals vaccinated on Day 3 with ACAM2000® (F) or IMVAMUNE® (G). For study data, the bars (color coded as described above) represent the range of days postexposure when the onset of each stage was observed in each individual animal. The fractions in the boxes represent the number of study animals that manifested clinical signs of each stage over the total number of animals in that group.

